Filing Flows › Materials › Freeport-McMoRan (FCX)
Freeport-McMoRan (FCX) earnings and revenue breakdown
Latest: Q3 2026 · 10-Q filed Nov 6, 2026 · Freeport-McMoRan (FCX) Q3 2026 earnings results →
Q3 2026 Revenue up 8% year over year to $7.5B · 16¢ of every $1 of revenue kept as net profit · operating margin 31.2%
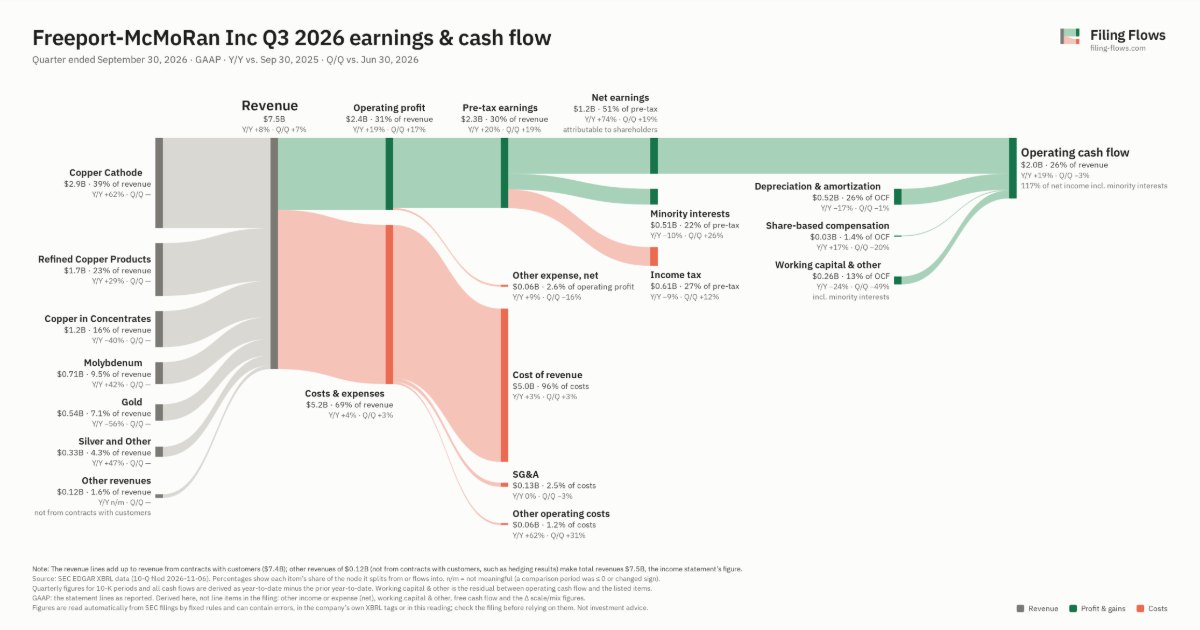
Freeport-McMoRan made $7.5B in Q3 2026 (+8% Y/Y): Copper Cathode $2.9B, Refined Copper Products $1.7B, Copper in Concentrates $1.2B. Operating margin 31.2%, net earnings $1.2B. See where every dollar goes — costs, profit and cash — as a Sankey from the 10-Q filed Nov 6, 2026.
Drawing the Sankey…
Open the interactive Sankey → click any line for what the company wrote about it, compare Y/Y and Q/Q, export as PNG or PDF
What changed this quarter
Revenue was $7.5B in Q3 2026, up 8% year over year and up 7% from the previous quarter. Copper Cathode was the largest line at 39% of revenue. Copper Cathode added $1.1B year over year (up 62%), 197% of the total change. Gold declined 56%.
Operating profit was $2.4B, a 31.2% margin (up 2.9 points year over year). Of the extra revenue versus Q3 2025, 66% reached operating profit, above the 28% margin then. Total costs grew 4% against revenue growth of 8%. The fastest-growing cost line was Other operating costs (+62%). Net earnings were $1.2B, up 74% year over year. The effective tax rate was 26.5%.
Operating cash flow was $2.0B (up 19% year over year), 117% of net income including minority interests. Non-cash charges added back $0.52B of depreciation and amortization and $0.03B of share-based compensation. Working capital and other items used $0.26B.
Quarterly history
| Quarter | Form | Filed | Revenue | Y/Y | Op. margin | Net earnings | Op. cash flow |
|---|---|---|---|---|---|---|---|
| Q3 2026 | 10-Q | Nov 6, 2026 | $7.5B | +8% | 31.2% | $1.2B | $2.0B |
| Q2 2026 | 10-Q | Aug 6, 2026 | $7.0B | -7% | 28.5% | $984M | $2.0B |
| Q1 2026 | 10-Q | May 8, 2026 | $6.2B | +9% | 34.3% | $881M | $1.5B |
| Q4 2025 | 10-K | Feb 13, 2026 | $5.6B | -2% | 14.4% | $406M | $693M |
| Q3 2025 | 10-Q | Nov 6, 2025 | $7.0B | +3% | 28.3% | $674M | $1.7B |
| Q2 2025 | 10-Q | Aug 8, 2025 | $7.6B | +14% | 32.1% | $772M | $2.2B |
| Q1 2025 | 10-Q | May 8, 2025 | $5.7B | -9% | 22.7% | $352M | $1.1B |
Charts
Interactive views
The same charts as the app — open one to draw it.
💵Where each $1 goesinteractive
Loading the interactive chart…
🌏Named in Asian annual reportsinteractive
Loading the interactive chart…
🔄Rotation against the market and its industry (RRG)interactive
Loading the interactive chart…
🔍Earnings qualityinteractive
Loading the interactive chart…
⚖️Fair value by methodinteractive
Loading the interactive chart…
🔭Outlook & guidanceinteractive
Loading the interactive chart…
📈Investments: gains and what it boughtinteractive
Loading the interactive chart…
🏭Its industry’s money flow (input-output)interactive
Loading the interactive chart…
Customers and suppliers named in filings
Sells to
- MIMTF — 17% of its revenue · Stated in 10-K (XBRL) · source
About Freeport-McMoRan
Cerro Verde. In May 2026, FCX purchased 2.0 million shares of Cerro Verde common stock for $ 107 million, increasing FCX’s ownership interest in Cerro Verde from 55.08 % to 55.66 %. As a result of the transaction, the carrying value of Cerro Verde’s noncontrolling interest was reduced by $ 36 million, and $ 73 million was recorded to reduce capital in excess of par value, including a $ 2 million deferred tax impact. Subsequent Events. FCX evaluated events after September 30, 2026, and through the date the consolidated financial statements were issued and determined that any events and transactions occurring during this period that would require recognition or disclosure are appropriately addressed in these consolidated financial statements.
In its own words, from its 10-Q, filed Nov 6, 2026.
Freeport-McMoRan against its Metal Mining peers
The largest companies of the same SEC industry, each at its latest quarter. Revenue growth: +8% against the peers' median +30%. Operating margin: 31.2% against the peers' median -14.9%.
| Company | Quarter | Revenue | Y/Y | Op. margin |
|---|---|---|---|---|
| FCX Freeport-McMoRan | Q3 2026 | $7.5B | +8% | 31.2% |
| CLF Cleveland-Cliffs | Q3 2026 | $5.6B | +18% | 5.5% |
| SCCO Southern Copper | Q3 2026 | $4.7B | +39% | 59.9% |
| MP MP Materials | Q3 2026 | $148M | +176% | -14.9% |
| DYNR Dynaresource | Q2 2026 | $11.4M | -28% | -10.1% |
| USAR USA Rare Earth | Q2 2026 | $5.8M | — | -795.6% |
| ALOY Realloys | Q2 2026 | $804K | +55% | n/m |
| IE Ivanhoe Electric | Q3 2026 | $708K | +30% | n/m |
| MINR Minerva Gold | Q1 FY27 | $9K | -25% | -24.7% |
Source: Freeport-McMoRan 10-Q on SEC EDGAR · CIK 831259 · Metal Mining
Guidance and outlook
13F: who owns FCX and who is buying
More on FCX
- How Freeport-McMoRan makes money: revenue by segment
- Freeport-McMoRan stock forecast, price target and fair value
- Who owns Freeport-McMoRan stock: holders, funds and Congress trades
- Freeport-McMoRan guidance and outlook
- Is Freeport-McMoRan a takeover target? LBO and rumors
- Freeport-McMoRan recalls, complaints and regulation
History
Every quarter: Q3 2026 results · Q2 2026 results · Q1 2026 results · Q4 2025 results · Q3 2025 results · Q2 2025 results · Q1 2025 results