Filing Flows › Technology › Fabrinet (FN)
Fabrinet (FN) earnings and revenue breakdown
Latest: Q1 FY27 · 10-Q filed Nov 3, 2026 · Fabrinet (FN) Q1 FY27 earnings results →
Q1 FY27 Revenue up 51% year over year to $1.5B · 7¢ of every $1 of revenue kept as net profit · operating margin 9.9%
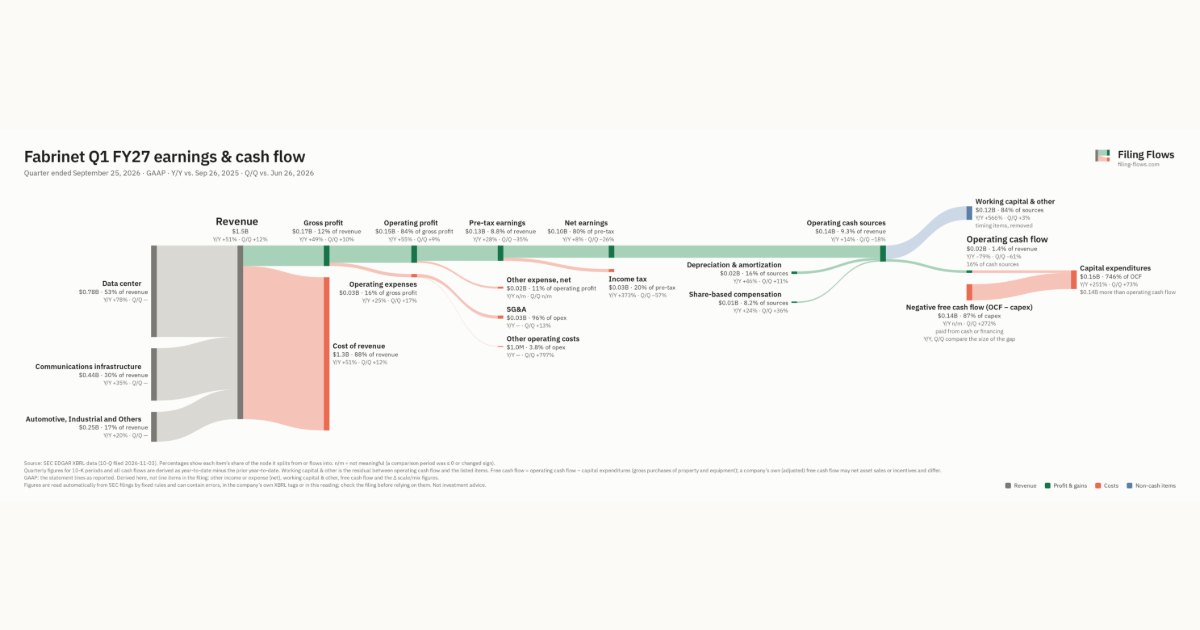
Fabrinet made $1.5B in Q1 FY27 (+51% Y/Y): Data center $777M, Communications infrastructure $444M, Automotive, Industrial and Others $253M. Operating margin 9.9%, net earnings $103M. See where every dollar goes — costs, profit and cash — as a Sankey from the 10-Q filed Nov 3, 2026.
Drawing the Sankey…
Open the interactive Sankey → click any line for what the company wrote about it, compare Y/Y and Q/Q, export as PNG or PDF
What changed this quarter
Revenue was $1.5B in Q1 FY27, up 51% year over year and up 12% from the previous quarter. Data center was the largest line at 53% of revenue. Data center added $0.34B year over year (up 78%), 68% of the total change.
Gross margin was 11.8%, down 0.1 points from Q1 FY26. Operating profit was $0.15B, a 9.9% margin (up 0.3 points year over year). Of the extra revenue versus Q1 FY26, 10% reached operating profit, above the 10% margin then. Operating expenses grew 25% against revenue growth of 51%. Net earnings were $0.10B, up 8% year over year. The effective tax rate was 20.1%.
Operating cash flow was $0.02B (down 79% year over year), 21% of net earnings. Non-cash charges added back $0.02B of depreciation and amortization and $0.01B of share-based compensation. Working capital and other items used $0.12B. Capital expenditures of $0.16B exceeded it, leaving free cash flow of −$0.14B.
Quarterly history
| Quarter | Form | Filed | Revenue | Y/Y | Op. margin | Net earnings | Op. cash flow |
|---|---|---|---|---|---|---|---|
| Q1 FY27 | 10-Q | Nov 3, 2026 | $1.5B | +51% | 9.9% | $103M | $21.3M |
| Q4 FY26 | 10-K | Aug 18, 2026 | $1.3B | +45% | 10.2% | $139M | $55.0M |
| Q3 FY26 | 10-Q | May 5, 2026 | $1.2B | +39% | 9.9% | $125M | $52.9M |
| Q2 FY26 | 10-Q | Feb 3, 2026 | $1.1B | +36% | 10.1% | $113M | $46.3M |
| Q1 FY26 | 10-Q | Nov 4, 2025 | $978M | +22% | 9.6% | $95.9M | $103M |
| Q4 FY25 | 10-K | Aug 19, 2025 | $910M | +21% | 9.8% | $87.2M | $55.1M |
| Q3 FY25 | 10-Q | May 6, 2025 | $872M | +19% | 9.0% | $81.3M | $74.2M |
Charts
Interactive views
The same charts as the app — open one to draw it.
💵Where each $1 goesinteractive
Loading the interactive chart…
🌏Named in Asian annual reportsinteractive
Loading the interactive chart…
🔄Rotation against the market and its industry (RRG)interactive
Loading the interactive chart…
🔍Earnings qualityinteractive
Loading the interactive chart…
⚖️Fair value by methodinteractive
Loading the interactive chart…
🔭Outlook & guidanceinteractive
Loading the interactive chart…
📈Investments: gains and what it boughtinteractive
Loading the interactive chart…
🏭Its industry’s money flow (input-output)interactive
Loading the interactive chart…
Customers and suppliers named in filings
Sells to
- CSCO — 20% of its revenue · Stated in 10-K (customer table) · source
- NVDA — 16% of its revenue · Stated in 10-K (customer table) · source
- NOK — 11% of its revenue · Stated in 10-K (customer table) · source
- AMZN — 10% of its revenue · Stated in 10-K (customer table) · source
About Fabrinet
We provide advanced optical packaging and precision optical, electro-mechanical and electronic manufacturing services to original equipment manufacturers (“OEMs”) of complex products such as optical communication components, modules and sub-systems, industrial lasers, automotive components, medical devices and sensors. We offer a broad range of advanced optical and electro-mechanical capabilities across the entire manufacturing process, including process design and engineering, supply chain management, manufacturing, complex printed circuit board assembly, advanced packaging, integration, final assembly and testing. We are capable of producing a wide variety of high complexity products in any mix and any volume.
In its own words, from its 10-K, filed Aug 18, 2026.
Fabrinet against its Telephone & Telegraph Apparatus peers
The largest companies of the same SEC industry, each at its latest quarter. Revenue growth: +51% against the peers' median +37%. Operating margin: 9.9% against the peers' median 9.9%.
| Company | Quarter | Revenue | Y/Y | Op. margin |
|---|---|---|---|---|
| FN Fabrinet | Q1 FY27 | $1.5B | +51% | 9.9% |
| CIEN Ciena | Q3 FY26 | $1.7B | +37% | 18.0% |
| ADTN Adtran Holdings | Q3 2026 | $281M | +0.6% | -0.3% |
| CLFD Clearfield | Q3 FY26 | $43.9M | +13% | 5.9% |
| FKWL Franklin Wireless | Q4 FY26 | $8.4M | +21% | -21.5% |
| FIEE FiEE | Q2 2026 | $4.8M | 107× | 54.8% |
Source: Fabrinet 10-Q on SEC EDGAR · CIK 1408710 · Telephone & Telegraph Apparatus
Guidance and outlook
More on FN
History
Every quarter: Q1 FY27 results · Q4 FY26 results · Q3 FY26 results · Q2 FY26 results · Q1 FY26 results · Q4 FY25 results · Q3 FY25 results