Filing Flows › Communication Services › FuboTV (FUBO)
FuboTV (FUBO) earnings and revenue breakdown
Latest: Q3 FY26 · 10-Q filed Aug 5, 2026 · FuboTV (FUBO) Q3 FY26 earnings results →
Q3 FY26 Revenue up 290% year over year to $1.5B · 2¢ of every $1 of revenue lost · operating margin -1.8%
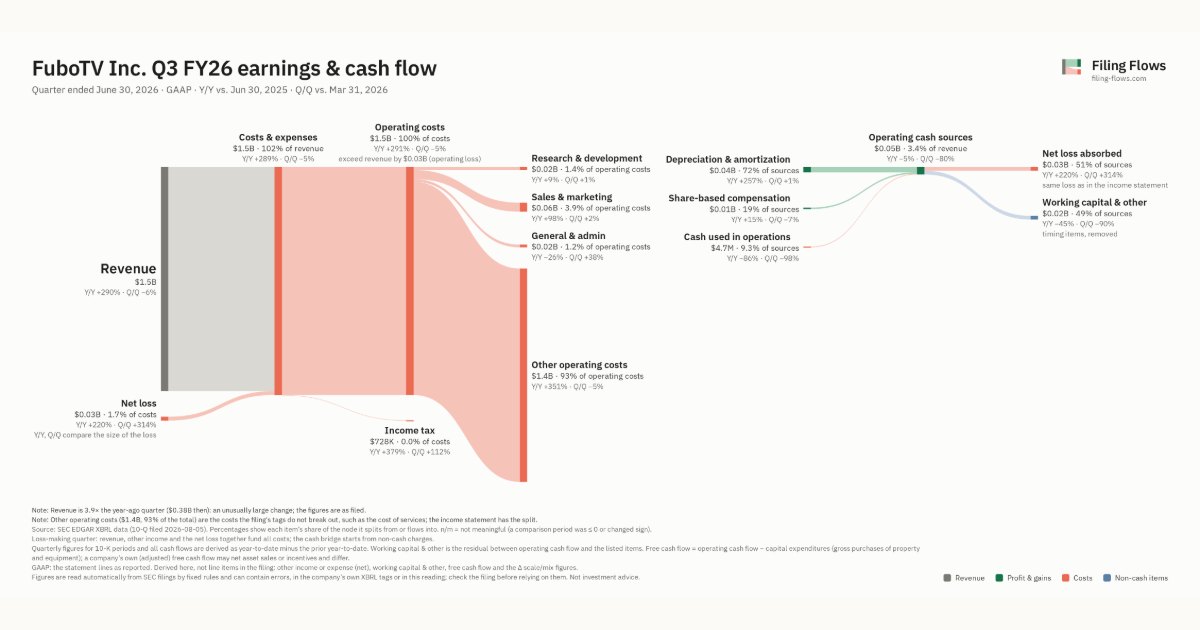
FuboTV made $1.5B in Q3 FY26 (+290% Y/Y). Operating margin -1.8%, net loss $25.7M. See where every dollar goes — costs, profit and cash — as a Sankey from the 10-Q filed Aug 5, 2026.
Drawing the Sankey…
Open the interactive Sankey → click any line for what the company wrote about it, compare Y/Y and Q/Q, export as PNG or PDF
What changed this quarter
Revenue was $1.5B in Q3 FY26, up 290% year over year and down 6% from the previous quarter.
Operating costs exceeded revenue by $0.03B, an operating margin of -1.8%. Total costs grew 291% against revenue growth of 290%. The fastest-growing cost line was Other operating costs (+351%). The quarter ended with a net loss of $0.03B, wider than the previous quarter's $0.01B loss. Minority interests bore $0.02B of it: to shareholders the quarter was a loss of $0.01B.
Operating cash flow was −$4.7M. Non-cash charges added back $0.04B of depreciation and amortization and $0.01B of share-based compensation. Working capital and other items used $0.02B. Capital expenditures of $467K exceeded it, leaving free cash flow of −$0.01B.
Quarterly history
| Quarter | Form | Filed | Revenue | Y/Y | Op. margin | Net earnings | Op. cash flow |
|---|---|---|---|---|---|---|---|
| Q3 FY26 | 10-Q | Aug 5, 2026 | $1.5B | +290% | -1.8% | −$25.7M | −$4.7M |
| Q2 FY26 | 10-Q | May 6, 2026 | $1.6B | +278% | -0.6% | −$6.2M | −$212M |
| Q1 FY26 | 10-Q | Feb 5, 2026 | $1.5B | +40% | -1.3% | −$19.1M | −$200M |
| Q4 FY25 | 10-Q | Nov 3, 2025 | $377M | -2% | -5.3% | −$18.9M | −$6.5M |
| Q3 FY25 | 10-Q | Aug 11, 2025 | $380M | -3% | -1.6% | −$8.0M | −$34.6M |
| Q1 FY25 | 10-K | Mar 3, 2025 | $443M | +8% | -8.7% | −$40.9M | $19.8M |
| Q1 FY24 | 10-K | Mar 5, 2024 | $410M | +28% | -17.6% | −$70.5M | −$2.1M |
Charts
Interactive views
The same charts as the app — open one to draw it.
💵Where each $1 goesinteractive
Loading the interactive chart…
🌏Named in Asian annual reportsinteractive
Loading the interactive chart…
🔄Rotation against the market and its industry (RRG)interactive
Loading the interactive chart…
🔍Earnings qualityinteractive
Loading the interactive chart…
⚖️Fair value by methodinteractive
Loading the interactive chart…
🔭Outlook & guidanceinteractive
Loading the interactive chart…
📈Investments: gains and what it boughtinteractive
Loading the interactive chart…
🏭Its industry’s money flow (input-output)interactive
Loading the interactive chart…
Customers and suppliers named in filings
Buys from
- GOOGL · Stated in 10-K (named, share not stated) · source
- AMZN · Stated in 10-K (named, share not stated) · source
About FuboTV
With a global mission to aggregate the best in TV, including premium sports, news and entertainment content, through a single app, Fubo aims to transcend the industry’s current TV model. We are a sports-first, Pay TV replacement product offering subscribers access to tens of thousands of live sporting events annually, alongside leading news and entertainment content, both live and on demand. Fubo’s platform is designed to empower customers to seamlessly access content through streaming devices and on Smart TVs, mobile phones, tablets, and computers.
In its own words, from its 10-K, filed Mar 3, 2025.
FuboTV against its Services-Motion Picture & Video Tape Production peers
The largest companies of the same SEC industry, each at its latest quarter. Revenue growth: +290% against the peers' median +22%. Operating margin: -1.8% against the peers' median -6.6%.
| Company | Quarter | Revenue | Y/Y | Op. margin |
|---|---|---|---|---|
| FUBO FuboTV | Q3 FY26 | $1.5B | +290% | -1.8% |
| LION Lionsgate Studios | Q2 FY27 | $669M | +41% | 4.4% |
| STRZ Starz Entertainment | Q3 2026 | $322M | +0.5% | -6.6% |
| ANGX Angel Studios | Q2 2026 | $112M | +28% | -16.6% |
| CURI CuriosityStream | Q2 2026 | $23.2M | +22% | 39.5% |
| GAIA Gaia | Q3 2026 | $22.0M | -12% | -13.4% |
| TOON Kartoon Studios | Q2 2026 | $5.8M | -43% | -58.6% |
| CPLX Certiplex | Q2 2026 | $26K | -35% | -71.3% |
Source: FuboTV 10-Q on SEC EDGAR · CIK 1484769 · Services-Motion Picture & Video Tape Production
13F: who owns FUBO and who is buying
More on FUBO
History
Every quarter: Q3 FY26 results · Q2 FY26 results · Q1 FY26 results · Q4 FY25 results · Q3 FY25 results · Q1 FY25 results · Q1 FY24 results