Filing Flows › Industrials › Genpact (G)
Genpact (G) earnings and revenue breakdown
Latest: Q3 2026 · 10-Q filed Nov 6, 2026 · Genpact (G) Q3 2026 earnings results →
Q3 2026 Revenue up 7% year over year to $1.4B · 11¢ of every $1 of revenue kept as net profit · operating margin 15.2%
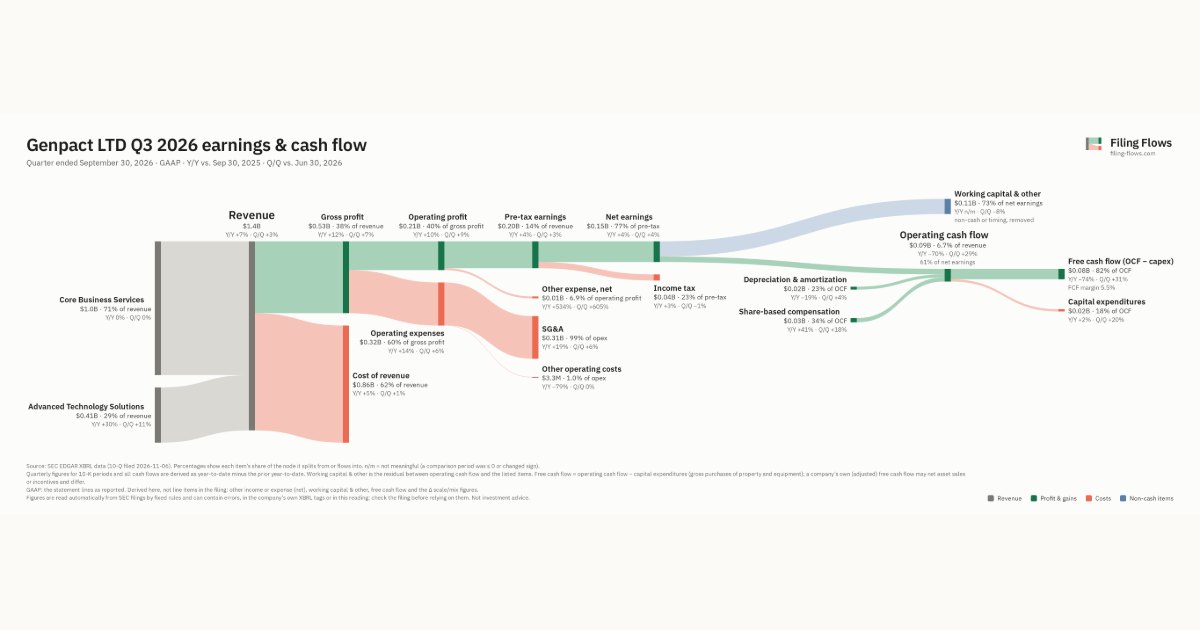
Genpact made $1.4B in Q3 2026 (+7% Y/Y): Core Business Services $980M, Advanced Technology Solutions $405M. Operating margin 15.2%, net earnings $152M. See where every dollar goes — costs, profit and cash — as a Sankey from the 10-Q filed Nov 6, 2026.
Drawing the Sankey…
Open the interactive Sankey → click any line for what the company wrote about it, compare Y/Y and Q/Q, export as PNG or PDF
What changed this quarter
Revenue was $1.4B in Q3 2026, up 7% year over year and up 3% from the previous quarter. Core Business Services was the largest line at 71% of revenue. Advanced Technology Solutions added $0.09B year over year (up 30%), 100% of the total change.
Gross margin was 38.0%, up 1.6 points from Q3 2025. Operating profit was $0.21B, a 15.2% margin (up 0.4 points year over year). Of the extra revenue versus Q3 2025, 21% reached operating profit, above the 15% margin then. Operating expenses grew 14% against revenue growth of 7%. The fastest-growing cost line was SG&A (+19%). Net earnings were $0.15B, up 4% year over year. The effective tax rate was 22.8%.
Operating cash flow was $0.09B (down 70% year over year), 61% of net earnings. Non-cash charges added back $0.02B of depreciation and amortization and $0.03B of share-based compensation. Working capital and other items used $0.11B. Capital expenditures of $0.02B left free cash flow of $0.08B.
Quarterly history
| Quarter | Form | Filed | Revenue | Y/Y | Op. margin | Net earnings | Op. cash flow |
|---|---|---|---|---|---|---|---|
| Q3 2026 | 10-Q | Nov 6, 2026 | $1.4B | +7% | 15.2% | $152M | $93.1M |
| Q2 2026 | 10-Q | Aug 7, 2026 | $1.3B | +7% | 14.4% | $146M | $72.4M |
| Q1 2026 | 10-Q | May 8, 2026 | $1.3B | +7% | 15.3% | $148M | −$23.5M |
| Q4 2025 | 10-K | Feb 26, 2026 | $1.3B | +6% | 14.8% | $143M | $287M |
| Q3 2025 | 10-Q | Nov 7, 2025 | $1.3B | +7% | 14.8% | $146M | $308M |
| Q2 2025 | 10-Q | Aug 11, 2025 | $1.3B | +7% | 14.3% | $133M | $177M |
| Q1 2025 | 10-Q | May 12, 2025 | $1.2B | +7% | 15.1% | $131M | $40.4M |
Charts
Interactive views
The same charts as the app — open one to draw it.
💵Where each $1 goesinteractive
Loading the interactive chart…
🌏Named in Asian annual reportsinteractive
Loading the interactive chart…
🔄Rotation against the market and its industry (RRG)interactive
Loading the interactive chart…
🔍Earnings qualityinteractive
Loading the interactive chart…
⚖️Fair value by methodinteractive
Loading the interactive chart…
🔭Outlook & guidanceinteractive
Loading the interactive chart…
📈Investments: gains and what it boughtinteractive
Loading the interactive chart…
🏭Its industry’s money flow (input-output)interactive
Loading the interactive chart…
About Genpact
Genpact is an agentic and advanced technology solutions company recognized for its deep industry knowledge, process intelligence and last mile expertise. With decades of client trust and a strong partner ecosystem, we provide innovative solutions that transform how businesses run. Powered by a team with an active learning mindset and client centricity at its core, we deliver lasting value for the world's leading enterprises. We have over 146,500 employees and serve clients from more than 35 countries around the world. Our 2025 total net revenues were $5.1 billion.
In its own words, from its 10-K, filed Feb 26, 2026.
Genpact against its Services-Management Consulting Services peers
The largest companies of the same SEC industry, each at its latest quarter. Revenue growth: +7% against the peers' median +6%. Operating margin: 15.2% against the peers' median 8.9%.
| Company | Quarter | Revenue | Y/Y | Op. margin |
|---|---|---|---|---|
| G Genpact | Q3 2026 | $1.4B | +7% | 15.2% |
| BAH Booz Allen Hamilton Holding | Q2 FY27 | $2.8B | -4% | 8.8% |
| ASTH Astrana Health | Q3 2026 | $1.0B | +7% | 3.9% |
| FCN FTI Consulting | Q3 2026 | $1.0B | +6% | 8.9% |
| HURN Huron Consulting Group | Q3 2026 | $491M | +11% | 12.0% |
| ICFI ICF International | Q3 2026 | $470M | +1% | 9.3% |
| ONT Onterris | Q3 2026 | $203M | -10% | 6.0% |
| EXPO Exponent | Q3 2026 | $174M | +18% | 24.1% |
| RMR RMR Group | Q3 FY26 | $154M | -0.8% | -6.0% |
Source: Genpact 10-Q on SEC EDGAR · CIK 1398659 · Services-Management Consulting Services
Guidance and outlook
More on G
History
Every quarter: Q3 2026 results · Q2 2026 results · Q1 2026 results · Q4 2025 results · Q3 2025 results · Q2 2025 results · Q1 2025 results
- Genpact guidance history: guided vs reported
- Genpact gross margin by quarter
- Genpact operating margin by quarter
- Genpact net income by quarter
- Genpact free cash flow by quarter
- Genpact capital expenditures by quarter
- Genpact Core Business Services revenue by quarter
- Genpact Advanced Technology Solutions revenue by quarter