Filing Flows › Industrials › General Electric (GE)
General Electric (GE) earnings and revenue breakdown
Latest: Q3 2026 · 10-Q filed Oct 20, 2026 · General Electric (GE) Q3 2026 earnings results →
Q3 2026 Revenue up 16% year over year to $14.1B · 16¢ of every $1 of revenue kept as net profit · operating margin 16.8%
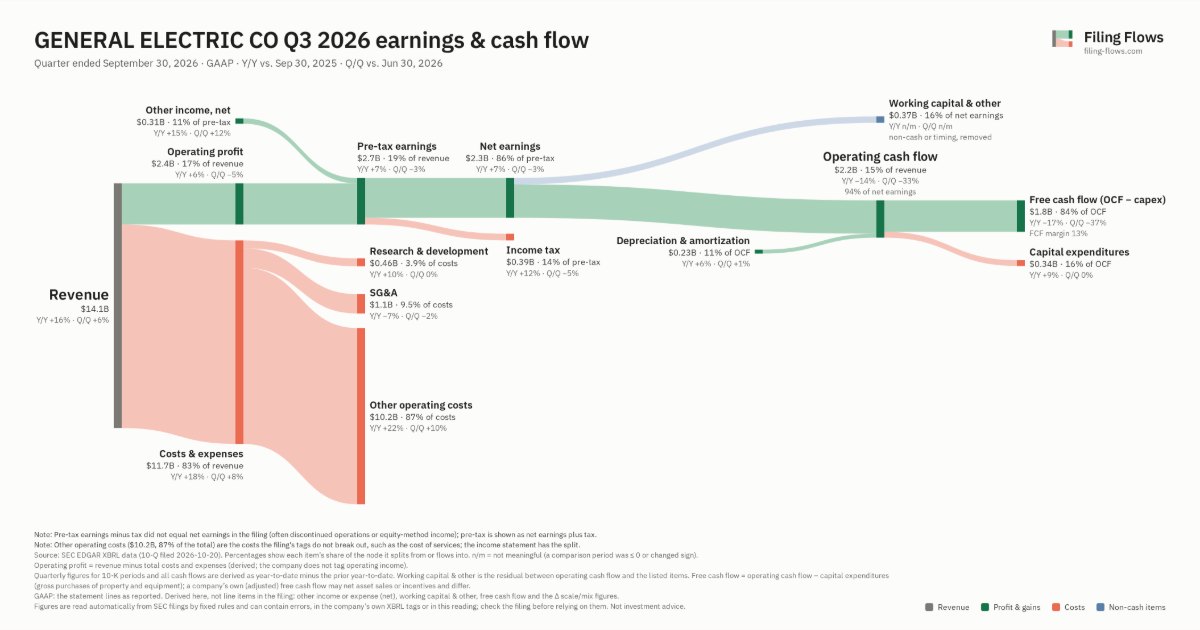
General Electric made $14.1B in Q3 2026 (+16% Y/Y). Operating margin 16.8%, net earnings $2.3B. See where every dollar goes — costs, profit and cash — as a Sankey from the 10-Q filed Oct 20, 2026.
Drawing the Sankey…
Open the interactive Sankey → click any line for what the company wrote about it, compare Y/Y and Q/Q, export as PNG or PDF
What changed this quarter
Revenue was $14.1B in Q3 2026, up 16% year over year and up 6% from the previous quarter.
Operating profit was $2.4B, a 16.8% margin (down 1.5 points year over year). Of the extra revenue versus Q3 2025, 7% reached operating profit, below the 18% margin then. Total costs grew 18% against revenue growth of 16%. The fastest-growing cost line was Other operating costs (+22%). Net earnings were $2.3B, up 6% year over year. The effective tax rate was 14.4%.
Operating cash flow was $2.2B (down 14% year over year), 94% of net earnings. Non-cash charges added back $0.23B of depreciation and amortization. Working capital and other items used $0.37B. Capital expenditures of $0.34B left free cash flow of $1.8B.
Quarterly history
| Quarter | Form | Filed | Revenue | Y/Y | Op. margin | Net earnings | Op. cash flow |
|---|---|---|---|---|---|---|---|
| Q3 2026 | 10-Q | Oct 20, 2026 | $14.1B | +16% | 16.8% | $2.3B | $2.2B |
| Q2 2026 | 10-Q | Jul 16, 2026 | $13.3B | +21% | 18.6% | $2.4B | $3.2B |
| Q1 2026 | 10-Q | Apr 21, 2026 | $12.4B | +25% | 17.9% | $1.9B | $1.8B |
| Q4 2025 | 10-K | Jan 29, 2026 | $12.7B | +18% | 17.7% | $2.6B | $2.3B |
| Q3 2025 | 10-Q | Oct 21, 2025 | $12.2B | +24% | 18.3% | $2.2B | $2.5B |
| Q2 2025 | 10-Q | Jul 21, 2025 | $11.0B | +21% | 19.0% | $2.0B | $2.2B |
| Q1 2025 | 10-Q | Apr 22, 2025 | $9.9B | +11% | 19.6% | $2.0B | $1.5B |
Charts
Interactive views
The same charts as the app — open one to draw it.
💵Where each $1 goesinteractive
Loading the interactive chart…
🌏Named in Asian annual reportsinteractive
Loading the interactive chart…
🔄Rotation against the market and its industry (RRG)interactive
Loading the interactive chart…
🔍Earnings qualityinteractive
Loading the interactive chart…
⚖️Fair value by methodinteractive
Loading the interactive chart…
🔭Outlook & guidanceinteractive
Loading the interactive chart…
📈Investments: gains and what it boughtinteractive
Loading the interactive chart…
🏭Its industry’s money flow (input-output)interactive
Loading the interactive chart…
Customers and suppliers named in filings
Sells to
- U.S. government — 10% of its revenue · Stated in 10-K (XBRL) · source
- HEI · Stated in 10-K (named, share not stated) · source
- WLFC · Stated in 10-K (named, share not stated) · source
- RJET · Stated in 10-K (named, share not stated) · source
- SKYW · Stated in 10-K (named, share not stated) · source
- PREM · Stated in 10-K (named, share not stated) · source
- DAL · Stated in 10-K (named, share not stated) · source
Buys from
- PKE — 39% of the supplier’s revenue · Stated in 10-K (XBRL) · source
- VREX · Stated in 10-K (named, share not stated) · source
About General Electric
GE Aerospace is a global aerospace propulsion, services, and systems leader with an installed base of approximately 50,000 commercial and 30,000 military aircraft engines. With a global team of approximately 57,000 employees building on more than a century of innovation and learning, GE Aerospace is committed to inventing the future of flight, lifting people up, and bringing them home safely. Learn more about how GE Aerospace and its partners are defining flight for today, tomorrow and the future at www.geaerospace.com .
In its own words, from its 8-K, filed Jul 16, 2026.
General Electric against its Electronic & Other Electrical Equipment (No Computer Equip) peers
The largest companies of the same SEC industry, each at its latest quarter. Revenue growth: +16% against the peers' median +16%. Operating margin: 16.8% against the peers' median 15.8%.
| Company | Quarter | Revenue | Y/Y | Op. margin |
|---|---|---|---|---|
| GE General Electric | Q3 2026 | $14.1B | +16% | 16.8% |
| GEV GE Vernova | Q3 2026 | $12.6B | +27% | 11.0% |
| EMR Emerson Electric | Q3 FY26 | $4.9B | +7% | 18.8% |
| OTIS Otis Worldwide | Q3 2026 | $3.9B | +6% | 15.8% |
| TRNR Interactive Strength | Q2 2026 | $6.6M | +445% | -50.7% |
Source: General Electric 10-Q on SEC EDGAR · CIK 40545 · Electronic & Other Electrical Equipment (No Computer Equip)
13F: who owns GE and who is buying
More on GE
History
Every quarter: Q3 2026 results · Q2 2026 results · Q1 2026 results · Q4 2025 results · Q3 2025 results · Q2 2025 results · Q1 2025 results