Filing Flows › Industrials › Gold.com (GOLD)
Gold.com (GOLD) earnings and revenue breakdown
Latest: Q1 FY27 · 10-Q filed Nov 5, 2026 · Gold.com (GOLD) Q1 FY27 earnings results →
Q1 FY27 Revenue down 11% year over year to $3.3B · 0¢ of every $1 of revenue kept as net profit · operating margin 0.1%
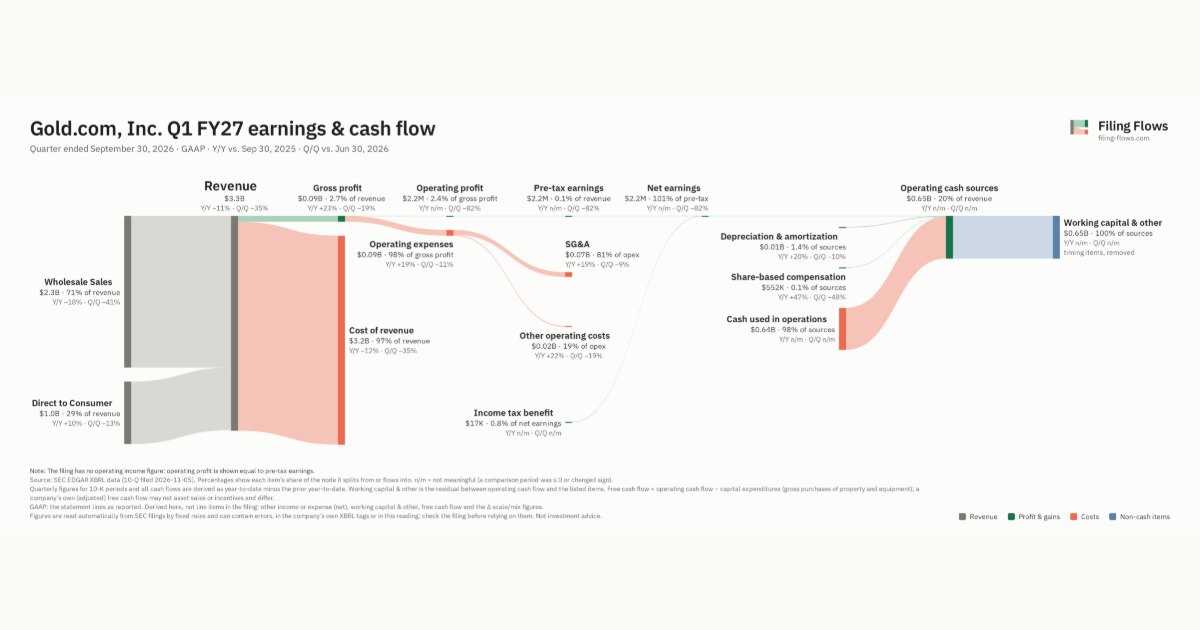
Gold.com made $3.3B in Q1 FY27 (-11% Y/Y): Wholesale Sales $2.3B, Direct to Consumer $950M. Operating margin 0.1%, net earnings $2.2M. See where every dollar goes — costs, profit and cash — as a Sankey from the 10-Q filed Nov 5, 2026.
Drawing the Sankey…
Open the interactive Sankey → click any line for what the company wrote about it, compare Y/Y and Q/Q, export as PNG or PDF
What changed this quarter
Revenue was $3.3B in Q1 FY27, down 11% year over year and down 35% from the previous quarter. Wholesale Sales was the largest line at 71% of revenue. Wholesale Sales lost $0.51B year over year (down 18%), 123% of the total change.
Gross margin was 2.7%, up 0.8 points from Q1 FY26. Operating profit was $2.2M, a 0.1% margin (up 0.1 points year over year). Operating expenses grew 19% against a revenue fall of 11%. The fastest-growing cost line was Other operating costs (+22%). Net earnings were $1.6M. The effective tax rate was -0.8%.
Operating cash flow was −$0.64B. Non-cash charges added back $0.01B of depreciation and amortization and $552K of share-based compensation. Working capital and other items used $0.65B. Capital expenditures of $4.5M exceeded it, leaving free cash flow of −$0.64B.
Quarterly history
| Quarter | Form | Filed | Revenue | Y/Y | Op. margin | Net earnings | Op. cash flow |
|---|---|---|---|---|---|---|---|
| Q1 FY27 | 10-Q | Nov 5, 2026 | $3.3B | -11% | 0.1% | $2.2M | −$639M |
| Q4 FY26 | 10-K | Sep 10, 2026 | $5.0B | +99% | 0.2% | $12.0M | $1.1B |
| Q3 FY26 | 10-Q | May 11, 2026 | $10.4B | +244% | 0.8% | $64.0M | $235K |
| Q2 FY26 | 10-Q | Feb 6, 2026 | $6.5B | +136% | 0.2% | $13.5M | −$42.6M |
| Q1 FY26 | 10-Q | Nov 7, 2025 | $3.7B | +36% | 0.0% | −$971K | $195M |
| Q4 FY25 | 10-K | Sep 11, 2025 | $2.5B | -0.5% | 0.5% | $10.2M | $67.0M |
| Q3 FY25 | 10-Q | May 12, 2025 | $3.0B | +15% | -0.3% | −$8.7M | $103M |
Charts
Interactive views
The same charts as the app — open one to draw it.
💵Where each $1 goesinteractive
Loading the interactive chart…
🌏Named in Asian annual reportsinteractive
Loading the interactive chart…
🔄Rotation against the market and its industry (RRG)interactive
Loading the interactive chart…
🔍Earnings qualityinteractive
Loading the interactive chart…
⚖️Fair value by methodinteractive
Loading the interactive chart…
🔭Outlook & guidanceinteractive
Loading the interactive chart…
📈Investments: gains and what it boughtinteractive
Loading the interactive chart…
🏭Its industry’s money flow (input-output)interactive
Loading the interactive chart…
Customers and suppliers named in filings
Sells to
- Deutsche Bank AG Customer — 22% of its revenue · Stated in 10-K (XBRL) · source
About Gold.com
Gold.com builds on gold’s storied history and heritage to define the future of alternative asset management. Founded in 1965, Gold.com offers comprehensive solutions for all aspects of the precious metals (gold, silver, platinum, and palladium) and collectibles (including rare coins and currency) value chains. Its vertically integrated platform combines market expertise with state-of-the-art logistics, financing, and minting capabilities to serve customers, collectors, and institutional clients globally. Gold.com’s direct-to-consumer marketplace, anchored by flagship brands JMBullion.com , Stack’s Bowers Galleries , GovMint.com , Monex Precious Metals , and Goldline , has served millions of customers.
In its own words, from its 8-K, filed Sep 3, 2026.
Source: Gold.com 10-Q on SEC EDGAR · CIK 1591588 · Wholesale-Jewelry, Watches, Precious Stones & Metals
Guidance and outlook
13F: who owns GOLD and who is buying
More on GOLD
History
Every quarter: Q1 FY27 results · Q4 FY26 results · Q3 FY26 results · Q2 FY26 results · Q1 FY26 results · Q4 FY25 results · Q3 FY25 results