Filing Flows › Consumer Discretionary › Hasbro (HAS)
Hasbro (HAS) earnings and revenue breakdown
Latest: Q3 2026 · 10-Q filed Oct 29, 2026 · Hasbro (HAS) Q3 2026 earnings results →
Q3 2026 Revenue up 0% year over year to $1.6B · 25¢ of every $1 of revenue kept as net profit · operating margin 32.4%
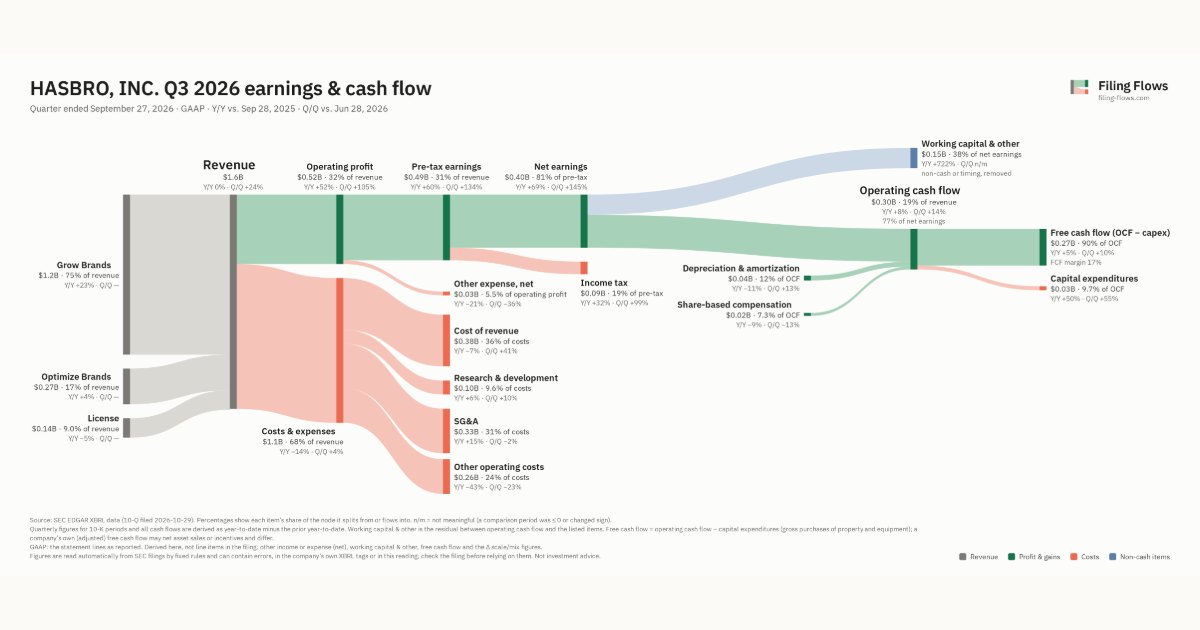
Hasbro made $1.6B in Q3 2026 (+0.3% Y/Y): Grow Brands $1.2B, Optimize Brands $266M, License $144M. Operating margin 32.4%, net earnings $395M. See where every dollar goes — costs, profit and cash — as a Sankey from the 10-Q filed Oct 29, 2026.
Drawing the Sankey…
Open the interactive Sankey → click any line for what the company wrote about it, compare Y/Y and Q/Q, export as PNG or PDF
What changed this quarter
Revenue was $1.6B in Q3 2026, roughly flat year over year and up 24% from the previous quarter. Grow Brands was the largest line at 75% of revenue. Grow Brands added $0.22B year over year (up 23%), 4287% of the total change. License declined 5%.
Operating profit was $0.52B, a 32.4% margin (up 11.0 points year over year). Of the extra revenue versus Q3 2025, 3388% reached operating profit, above the 21% margin then. Total costs fell 14% while revenue was flat. The fastest-growing cost line was SG&A (+15%). Net earnings were $0.39B, up 69% year over year. The effective tax rate was 19.2%.
Operating cash flow was $0.30B (up 8% year over year), 77% of net earnings. Non-cash charges added back $0.04B of depreciation and amortization and $0.02B of share-based compensation. Working capital and other items used $0.15B. Capital expenditures of $0.03B left free cash flow of $0.27B.
Quarterly history
| Quarter | Form | Filed | Revenue | Y/Y | Op. margin | Net earnings | Op. cash flow |
|---|---|---|---|---|---|---|---|
| Q3 2026 | 10-Q | Oct 29, 2026 | $1.6B | +0.3% | 32.4% | $395M | $303M |
| Q2 2026 | 10-Q | Jul 30, 2026 | $1.3B | +14% | 19.6% | $161M | $267M |
| Q1 2026 | 10-Q | May 13, 2026 | $1.1B | +11% | 24.3% | $198M | $338M |
| Q4 2025 | 10-K | Feb 25, 2026 | $1.4B | +15% | 20.6% | $202M | $403M |
| Q3 2025 | 10-Q | Nov 5, 2025 | $1.6B | +8% | 21.5% | $234M | $281M |
| Q2 2025 | 10-Q | Jul 31, 2025 | $1.1B | -0.7% | -70.4% | −$855M | $71.3M |
| Q1 2025 | 10-Q | May 6, 2025 | $1.0B | +15% | 17.0% | $98.6M | $138M |
Charts
Interactive views
The same charts as the app — open one to draw it.
💵Where each $1 goesinteractive
Loading the interactive chart…
🌏Named in Asian annual reportsinteractive
Loading the interactive chart…
🔄Rotation against the market and its industry (RRG)interactive
Loading the interactive chart…
🔍Earnings qualityinteractive
Loading the interactive chart…
⚖️Fair value by methodinteractive
Loading the interactive chart…
🔭Outlook & guidanceinteractive
Loading the interactive chart…
📈Investments: gains and what it boughtinteractive
Loading the interactive chart…
🏭Its industry’s money flow (input-output)interactive
Loading the interactive chart…
Customers and suppliers named in filings
Sells to
- AMZN — 11% of its revenue · Stated in 10-K (sentence) · source
- WMT — 9% of its revenue · Stated in 10-K (sentence) · source
About Hasbro
Hasbro, Inc. (“Hasbro”) is a leading game, intellectual property ("IP"), and toy company whose mission is to create joy and community through the magic of play. With over 100 years of expertise, we deliver play experiences to kids, families, and fans around the world, through physical and digital games, video games, toys, licensed consumer products, location-based entertainment, film, TV and more. Through our franchise-first approach, we unlock value from both new and legacy IP, including MAGIC: THE GATHERING, MONOPOLY, HASBRO GAMES, PLAY-DOH, TRANSFORMERS, DUNGEONS & DRAGONS, NERF, and PEPPA PIG, as well as premier partner brands. Powered by our portfolio of iconic brands and a diversified network of partners and subsidiary studios, we bring fans together wherever they are, from tabletop to screen.
In its own words, from its 10-K, filed Feb 25, 2026.
Hasbro against its Games, Toys & Children's Vehicles (No Dolls & Bicycles) peers
The largest companies of the same SEC industry, each at its latest quarter. Revenue growth: +0.3% against the peers' median +20%. Operating margin: 32.4% against the peers' median 14.7%.
| Company | Quarter | Revenue | Y/Y | Op. margin |
|---|---|---|---|---|
| HAS Hasbro | Q3 2026 | $1.6B | +0.3% | 32.4% |
| FNKO Funko | Q3 2026 | $258M | +3% | 5.8% |
| JAKK Jakks Pacific | Q3 2026 | $254M | +20% | 14.7% |
| NNUP Nocopi Technologies | Q2 2026 | $961K | +167% | -59.1% |
Source: Hasbro 10-Q on SEC EDGAR · CIK 46080 · Games, Toys & Children's Vehicles (No Dolls & Bicycles)
13F: who owns HAS and who is buying
More on HAS
History
Every quarter: Q3 2026 results · Q2 2026 results · Q1 2026 results · Q4 2025 results · Q3 2025 results · Q2 2025 results · Q1 2025 results