Filing Flows › Industrials › Herc Holdings (HRI)
Herc Holdings (HRI) earnings and revenue breakdown
Latest: Q3 2026 · 10-Q filed Oct 27, 2026 · Herc Holdings (HRI) Q3 2026 earnings results →
Q3 2026 Revenue up 5% year over year to $1.4B · 8¢ of every $1 of revenue kept as net profit · operating margin 8.8%
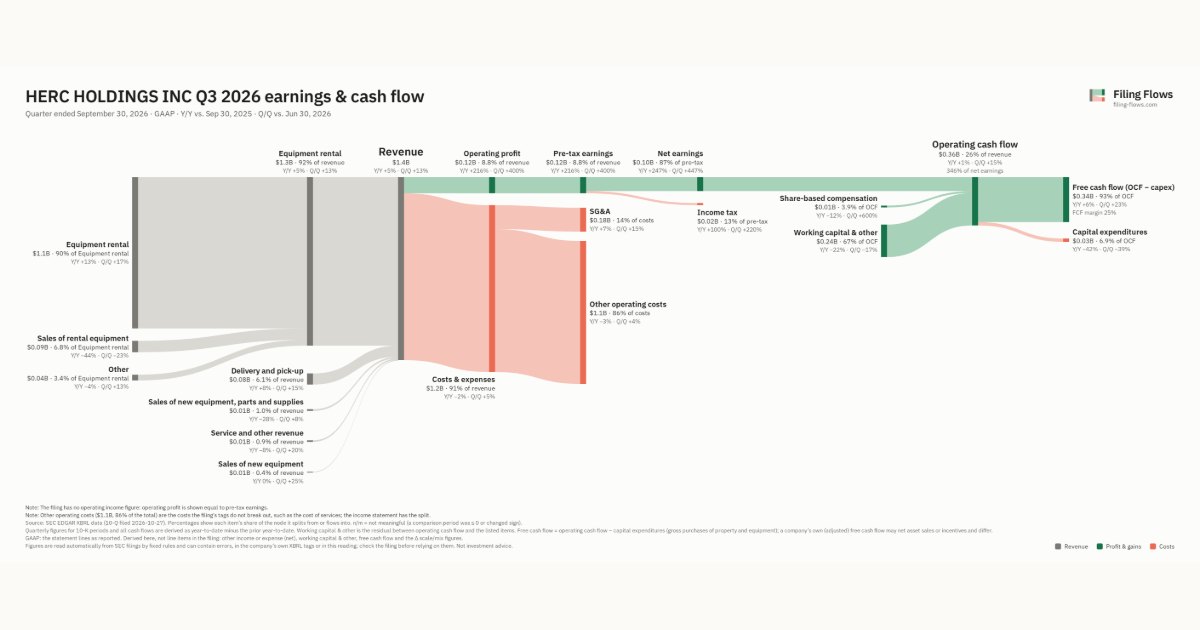
Herc Holdings made $1.4B in Q3 2026 (+5% Y/Y): Equipment rental $1.3B, Delivery and pick-up $83.0M, Sales of new equipment, parts and supplies $13.0M. Operating margin 8.8%, net earnings $104M. See where every dollar goes — costs, profit and cash — as a Sankey from the 10-Q filed Oct 27, 2026.
Drawing the Sankey…
Open the interactive Sankey → click any line for what the company wrote about it, compare Y/Y and Q/Q, export as PNG or PDF
What changed this quarter
Revenue was $1.4B in Q3 2026, up 5% year over year and up 13% from the previous quarter. Equipment rental was the largest line at 83% of revenue. Equipment rental added $0.13B year over year (up 13%), 213% of the total change. Sales of rental equipment declined 44%.
Operating profit was $0.12B, a 8.8% margin (up 5.9 points year over year). Of the extra revenue versus Q3 2025, 137% reached operating profit, above the 3% margin then. Total costs fell 2% while revenue rose 5%. Net earnings were $0.10B, up 247% year over year. The effective tax rate was 13.3%.
Operating cash flow was $0.36B (up 1% year over year), 346% of net earnings. Non-cash charges added back $0.01B of share-based compensation. Working capital and other items added $0.24B. Capital expenditures of $0.03B left free cash flow of $0.34B.
Quarterly history
| Quarter | Form | Filed | Revenue | Y/Y | Op. margin | Net earnings | Op. cash flow |
|---|---|---|---|---|---|---|---|
| Q3 2026 | 10-Q | Oct 27, 2026 | $1.4B | +5% | 8.8% | $104M | $360M |
| Q2 2026 | 10-Q | Jul 28, 2026 | $1.2B | +20% | 2.0% | $19.0M | $314M |
| Q1 2026 | 10-Q | Apr 28, 2026 | $1.1B | +32% | -2.0% | −$24.0M | $277M |
| Q4 2025 | 10-K | Feb 17, 2026 | $1.2B | +27% | 1.4% | $24.0M | $315M |
| Q3 2025 | 10-Q | Oct 28, 2025 | $1.3B | +35% | 2.9% | $30.0M | $358M |
| Q2 2025 | 10-Q | Jul 29, 2025 | $1.0B | +18% | -4.6% | −$35.0M | $241M |
| Q1 2025 | 10-Q | Apr 22, 2025 | $861M | +7% | -0.9% | −$18.0M | $171M |
Charts
Interactive views
The same charts as the app — open one to draw it.
💵Where each $1 goesinteractive
Loading the interactive chart…
🌏Named in Asian annual reportsinteractive
Loading the interactive chart…
🔄Rotation against the market and its industry (RRG)interactive
Loading the interactive chart…
🔍Earnings qualityinteractive
Loading the interactive chart…
⚖️Fair value by methodinteractive
Loading the interactive chart…
🔭Outlook & guidanceinteractive
Loading the interactive chart…
📈Investments: gains and what it boughtinteractive
Loading the interactive chart…
🏭Its industry’s money flow (input-output)interactive
Loading the interactive chart…
About Herc Holdings
Herc Holdings Inc. ("we," "us," "our," "Herc Holdings," or "the Company") is one of the leading equipment rental suppliers with 607 locations in North America as of June 30, 2026. The Company conducts substantially all of its operations through subsidiaries, including Herc Rentals Inc. ("Herc"). With over 60 years of experience, the Company is a full-line equipment rental supplier offering a broad portfolio of equipment for rent, services and technologies aimed at helping customers work more efficiently, effectively and safely.
In its own words, from its 10-Q, filed Jul 28, 2026.
Herc Holdings against its Services-Miscellaneous Equipment Rental & Leasing peers
The largest companies of the same SEC industry, each at its latest quarter. Revenue growth: +5% against the peers' median +11%. Operating margin: 8.8% against the peers' median 21.0%.
| Company | Quarter | Revenue | Y/Y | Op. margin |
|---|---|---|---|---|
| HRI Herc Holdings | Q3 2026 | $1.4B | +5% | 8.8% |
| FTAI FTAI Aviation | Q3 2026 | $978M | +47% | 22.4% |
| WSC WillScot Holdings | Q3 2026 | $601M | +6% | 21.0% |
| NPKI NPK International | Q3 2026 | $76.3M | +11% | 12.0% |
Source: Herc Holdings 10-Q on SEC EDGAR · CIK 1364479 · Services-Miscellaneous Equipment Rental & Leasing
13F: who owns HRI and who is buying
More on HRI
History
Every quarter: Q3 2026 results · Q2 2026 results · Q1 2026 results · Q4 2025 results · Q3 2025 results · Q2 2025 results · Q1 2025 results
- Herc Holdings guidance history: guided vs reported
- Herc Holdings operating margin by quarter
- Herc Holdings net income by quarter
- Herc Holdings free cash flow by quarter
- Herc Holdings capital expenditures by quarter
- Herc Holdings Equipment rental revenue by quarter
- Herc Holdings Delivery and pick-up revenue by quarter
- Herc Holdings Sales of new equipment, parts and supplies revenue by quarter