Filing Flows › Materials › Huntsman (HUN)
Huntsman (HUN) earnings and revenue breakdown
Latest: Q3 2026 · 10-Q filed Nov 3, 2026 · Huntsman (HUN) Q3 2026 earnings results →
Q3 2026 Revenue up 18% year over year to $1.7B · 0¢ of every $1 of revenue lost · operating margin 2.3%
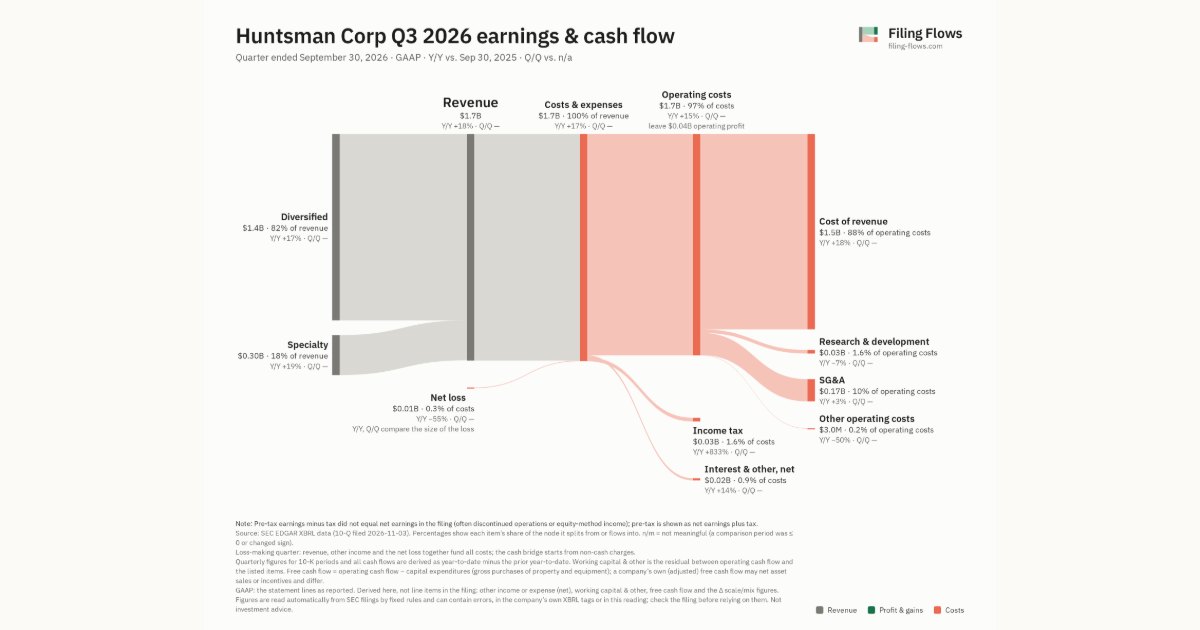
Huntsman made $1.7B in Q3 2026 (+18% Y/Y): Diversified $1.4B, Specialty $303M. Operating margin 2.3%, net loss $5.0M. See where every dollar goes — costs, profit and cash — as a Sankey from the 10-Q filed Nov 3, 2026.
Drawing the Sankey…
Open the interactive Sankey → click any line for what the company wrote about it, compare Y/Y and Q/Q, export as PNG or PDF
What changed this quarter
Revenue was $1.7B in Q3 2026, up 18% year over year. Diversified was the largest line at 82% of revenue. Diversified added $0.21B year over year (up 17%), 82% of the total change.
Gross margin was 13.8%, down 0.2 points from a year earlier. Operating profit was $0.04B, a 2.3% margin (up 1.9 points year over year). Of the extra revenue versus a year earlier, 13% reached operating profit, above the 0% margin then. Operating expenses grew 0% against revenue growth of 18%. The quarter ended with a net loss of $0.01B. Net interest and other expense of $0.02B was the main reason.
Operating cash flow was $0.11B (down 44% year over year). Non-cash charges added back $0.08B of depreciation and amortization and $0.01B of share-based compensation. Working capital and other items added $0.03B. Capital expenditures of $0.03B left free cash flow of $0.08B.
Quarterly history
| Quarter | Form | Filed | Revenue | Y/Y | Op. margin | Net earnings | Op. cash flow |
|---|---|---|---|---|---|---|---|
| Q3 2026 | 10-Q | Nov 3, 2026 | $1.7B | +18% | 2.3% | −$5.0M | $110M |
| Q2 2026 | 10-Q | Jul 31, 2026 | $1.7B | +14% | 2.2% | $7.0M | −$60.0M |
| Q1 2026 | 10-Q | May 1, 2026 | $1.4B | +0.7% | -1.1% | −$41.0M | −$53.0M |
| Q2 2025 | 10-Q | Aug 1, 2025 | $1.5B | -7% | -8.2% | −$145M | $91.0M |
| Q1 2025 | 10-Q | May 2, 2025 | $1.4B | -4% | 3.0% | $11.0M | −$74.0M |
Charts
Interactive views
The same charts as the app — open one to draw it.
💵Where each $1 goesinteractive
Loading the interactive chart…
🌏Named in Asian annual reportsinteractive
Loading the interactive chart…
🔄Rotation against the market and its industry (RRG)interactive
Loading the interactive chart…
🔍Earnings qualityinteractive
Loading the interactive chart…
⚖️Fair value by methodinteractive
Loading the interactive chart…
🔭Outlook & guidanceinteractive
Loading the interactive chart…
📈Investments: gains and what it boughtinteractive
Loading the interactive chart…
🏭Its industry’s money flow (input-output)interactive
Loading the interactive chart…
About Huntsman
We are a global manufacturer of diversified organic chemical products. We operate in three segments: Polyurethanes, Performance Products and Advanced Materials. Our products comprise many different chemicals and chemical formulations, which we market globally to a wide range of consumers that consist primarily of industrial and building product manufacturers. Our products are used in a broad range of applications, including those in the adhesives, aerospace, automotive, coatings and construction, construction products, durable and non-durable consumer products, electronics, insulation, power generation and refining. Many of our products offer effects such as premium insulation in homes and buildings and the lightweighting of airplanes and automobiles that help conserve energy.
In its own words, from its 10-K, filed Feb 18, 2026.
Huntsman against its Chemicals & Allied Products peers
The largest companies of the same SEC industry, each at its latest quarter. Revenue growth: +18% against the peers' median +8%. Operating margin: 2.3% against the peers' median 9.5%.
| Company | Quarter | Revenue | Y/Y | Op. margin |
|---|---|---|---|---|
| HUN Huntsman | Q3 2026 | $1.7B | +18% | 2.3% |
| OLN Olin | Q3 2026 | $1.7B | +2% | 3.4% |
| Huntsman International LLC | Q2 2026 | $1.7B | +14% | 2.2% |
| CC Chemours | Q3 2026 | $1.5B | +3% | 14.4% |
| SOLS Solstice Advanced Materials | Q3 2026 | $1.0B | +8% | 10.7% |
| IOSP Innospec | Q3 2026 | $474M | +7% | 8.8% |
| PRM Perimeter Group | Q3 2026 | $390M | +24% | 106.8% |
| ECVT Ecovyst | Q3 2026 | $309M | +51% | 9.5% |
| NGVT Ingevity | Q3 2026 | $305M | -8% | 22.0% |
Source: Huntsman 10-Q on SEC EDGAR · CIK 1307954 · Chemicals & Allied Products
Guidance and outlook
13F: who owns HUN and who is buying
More on HUN
- How Huntsman makes money: revenue by segment
- Huntsman next earnings date and what analysts expect
- Huntsman stock forecast, price target and fair value
- Who owns Huntsman stock: holders, funds and Congress trades
- Huntsman guidance and outlook
- Is Huntsman a takeover target? LBO and rumors
- Huntsman recalls, complaints and regulation
History
Every quarter: Q3 2026 results · Q2 2026 results · Q1 2026 results · Q2 2025 results · Q1 2025 results