Filing Flows › Materials › Chemours (CC)
Chemours (CC) earnings and revenue breakdown
Latest: Q3 2026 · 10-Q filed Nov 5, 2026 · Chemours (CC) Q3 2026 earnings results →
Q3 2026 Revenue up 3% year over year to $1.5B · 13¢ of every $1 of revenue kept as net profit · operating margin 14.4%
Chemours made $1.5B in Q3 2026 (+3% Y/Y): All Segments $1.5B, Other Non-Reportable Segment $13.0M. Operating margin 14.4%, net earnings $196M. See where every dollar goes — costs, profit and cash — as a Sankey from the 10-Q filed Nov 5, 2026.
Drawing the Sankey…
Open the interactive Sankey → click any line for what the company wrote about it, compare Y/Y and Q/Q, export as PNG or PDF
What changed this quarter
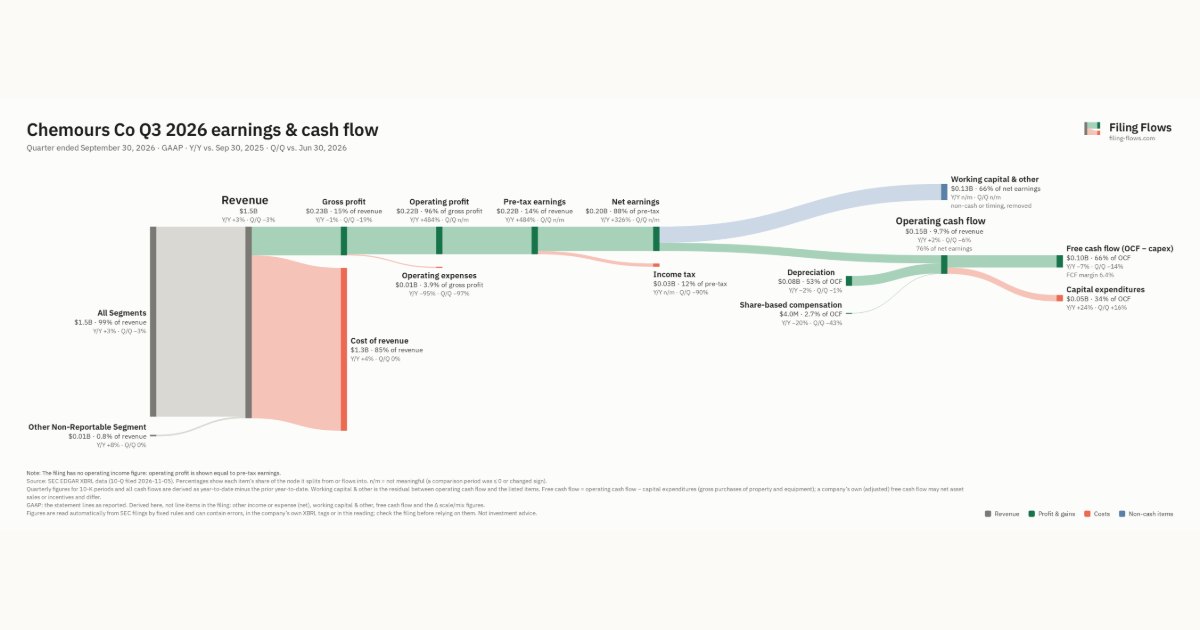
Revenue was $1.5B in Q3 2026, up 3% year over year and down 3% from the previous quarter. All Segments was the largest line at 99% of revenue. All Segments added $0.04B year over year (up 3%), 98% of the total change.
Gross margin was 15.0%, down 0.6 points from Q3 2025. Operating profit was $0.22B, a 14.4% margin (up 11.9 points year over year). Of the extra revenue versus Q3 2025, 409% reached operating profit, above the 3% margin then. Operating expenses fell 95% while revenue rose 3%. Net earnings were $0.20B, up 326% year over year. The effective tax rate was 11.7%.
Operating cash flow was $0.15B (up 2% year over year), 76% of net earnings. Non-cash charges added back $0.08B of depreciation and $4.0M of share-based compensation. Working capital and other items used $0.13B. Capital expenditures of $0.05B left free cash flow of $0.10B.
Quarterly history
| Quarter | Form | Filed | Revenue | Y/Y | Op. margin | Net earnings | Op. cash flow |
|---|---|---|---|---|---|---|---|
| Q3 2026 | 10-Q | Nov 5, 2026 | $1.5B | +3% | 14.4% | $196M | $149M |
| Q2 2026 | 10-Q | Aug 5, 2026 | $1.6B | -2% | -0.1% | −$274M | $158M |
| Q1 2026 | 10-Q | May 5, 2026 | $1.4B | +1% | -1.6% | −$29.0M | −$44.0M |
| Q4 2025 | 10-K | Feb 24, 2026 | $1.3B | -2% | -5.0% | −$47.0M | $137M |
| Q3 2025 | 10-Q | Nov 6, 2025 | $1.5B | -0.9% | 3.4% | $60.0M | $146M |
| Q2 2025 | 10-Q | Aug 5, 2025 | $1.6B | +4% | -16.1% | −$379M | $93.0M |
| Q1 2025 | 10-Q | May 6, 2025 | $1.4B | +0.4% | 0.0% | −$4.0M | −$112M |
Charts
Interactive views
The same charts as the app — open one to draw it.
💵Where each $1 goesinteractive
Loading the interactive chart…
🌏Named in Asian annual reportsinteractive
Loading the interactive chart…
🔄Rotation against the market and its industry (RRG)interactive
Loading the interactive chart…
🔍Earnings qualityinteractive
Loading the interactive chart…
⚖️Fair value by methodinteractive
Loading the interactive chart…
🔭Outlook & guidanceinteractive
Loading the interactive chart…
📈Investments: gains and what it boughtinteractive
Loading the interactive chart…
🏭Its industry’s money flow (input-output)interactive
Loading the interactive chart…
Customers and suppliers named in filings
Sells to
About Chemours
The Chemours Company (NYSE: CC) is a global leader in providing industrial and specialty chemicals products for markets, including coatings, plastics, refrigeration and air conditioning, transportation, semiconductor and advanced electronics, general industrial, and oil and gas. Through our three businesses – Thermal & Specialized Solutions, Titanium Technologies, and Advanced Performance Materials – we deliver application expertise and chemistry-based innovations that solve customers’ biggest challenges. Our flagship products are sold under prominent brands such as Opteon™, Freon™, Ti-Pure™, Nafion™, Teflon™, Viton™, and Krytox™. Headquartered in Wilmington, Delaware and listed on the NYSE under the symbol CC, Chemours has approximately 5,700 employees and 28 manufacturing sites and serves approximately 2,400 customers in approximately 110 countries.
In its own words, from its 8-K, filed Aug 4, 2026.
Chemours against its Chemicals & Allied Products peers
The largest companies of the same SEC industry, each at its latest quarter. Revenue growth: +3% against the peers' median +8%. Operating margin: 14.4% against the peers' median 9.5%.
| Company | Quarter | Revenue | Y/Y | Op. margin |
|---|---|---|---|---|
| CC Chemours | Q3 2026 | $1.5B | +3% | 14.4% |
| OLN Olin | Q3 2026 | $1.7B | +2% | 3.4% |
| HUN Huntsman | Q3 2026 | $1.7B | +18% | 2.3% |
| Huntsman International LLC | Q2 2026 | $1.7B | +14% | 2.2% |
| SOLS Solstice Advanced Materials | Q3 2026 | $1.0B | +8% | 10.7% |
| IOSP Innospec | Q3 2026 | $474M | +7% | 8.8% |
| PRM Perimeter Group | Q3 2026 | $390M | +24% | 106.8% |
| ECVT Ecovyst | Q3 2026 | $309M | +51% | 9.5% |
| NGVT Ingevity | Q3 2026 | $305M | -8% | 22.0% |
Source: Chemours 10-Q on SEC EDGAR · CIK 1627223 · Chemicals & Allied Products
Guidance and outlook
13F: who owns CC and who is buying
More on CC
History
Every quarter: Q3 2026 results · Q2 2026 results · Q1 2026 results · Q4 2025 results · Q3 2025 results · Q2 2025 results · Q1 2025 results