Filing Flows › Industrials › Watsco (WSO)
Watsco (WSO) earnings and revenue breakdown
Latest: Q3 2026 · 10-Q filed Nov 6, 2026 · Watsco (WSO) Q3 2026 earnings results →
Q3 2026 Revenue up 7% year over year to $2.2B · 7¢ of every $1 of revenue kept as net profit · operating margin 10.1%
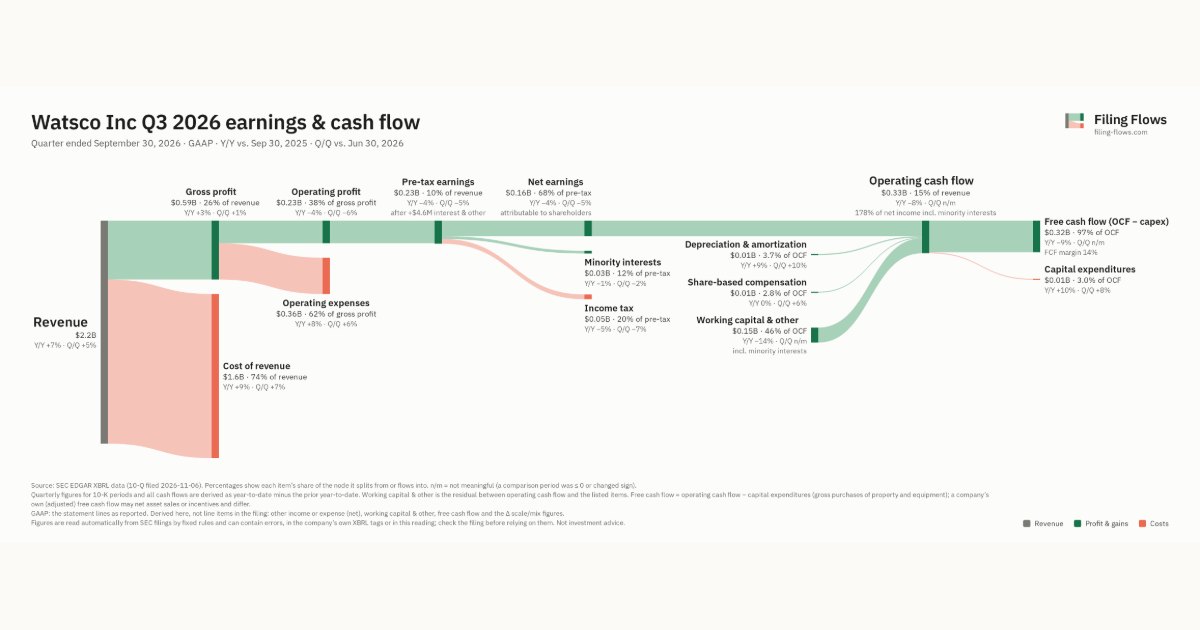
Watsco made $2.2B in Q3 2026 (+7% Y/Y). Operating margin 10.1%, net earnings $155M. See where every dollar goes — costs, profit and cash — as a Sankey from the 10-Q filed Nov 6, 2026.
Drawing the Sankey…
Open the interactive Sankey → click any line for what the company wrote about it, compare Y/Y and Q/Q, export as PNG or PDF
What changed this quarter
Revenue was $2.2B in Q3 2026, up 7% year over year and up 5% from the previous quarter.
Gross margin was 26.4%, down 1.1 points from Q3 2025. Operating profit was $0.23B, a 10.1% margin (down 1.2 points year over year). Operating profit fell $0.01B even though revenue rose $0.15B versus Q3 2025, so costs grew faster than sales. Operating expenses grew 8% against revenue growth of 7%. Net earnings were $0.16B, down 4% year over year. The effective tax rate was 20.4%.
Operating cash flow was $0.33B (down 8% year over year), 178% of net income including minority interests. Non-cash charges added back $0.01B of depreciation and amortization and $0.01B of share-based compensation. Working capital and other items added $0.12B. Capital expenditures of $0.01B left free cash flow of $0.32B.
Quarterly history
| Quarter | Form | Filed | Revenue | Y/Y | Op. margin | Net earnings | Op. cash flow |
|---|---|---|---|---|---|---|---|
| Q3 2026 | 10-Q | Nov 6, 2026 | $2.2B | +7% | 10.1% | $155M | $325M |
| Q2 2026 | 10-Q | Aug 7, 2026 | $2.1B | +2% | 11.3% | $163M | −$2.5M |
| Q1 2026 | 10-Q | May 8, 2026 | $1.5B | +0.1% | 7.2% | $79.1M | −$18.9M |
| Q4 2025 | 10-K | Feb 27, 2026 | $1.6B | -10% | 6.4% | $71.7M | $400M |
| Q3 2025 | 10-Q | Nov 7, 2025 | $2.1B | -4% | 11.4% | $162M | $355M |
| Q2 2025 | 10-Q | Aug 8, 2025 | $2.1B | -4% | 13.2% | $184M | −$7.4M |
| Q1 2025 | 10-Q | May 9, 2025 | $1.5B | -2% | 7.3% | $80.1M | −$178M |
Charts
Interactive views
The same charts as the app — open one to draw it.
💵Where each $1 goesinteractive
Loading the interactive chart…
🌏Named in Asian annual reportsinteractive
Loading the interactive chart…
🔄Rotation against the market and its industry (RRG)interactive
Loading the interactive chart…
🔍Earnings qualityinteractive
Loading the interactive chart…
⚖️Fair value by methodinteractive
Loading the interactive chart…
🔭Outlook & guidanceinteractive
Loading the interactive chart…
📈Investments: gains and what it boughtinteractive
Loading the interactive chart…
🏭Its industry’s money flow (input-output)interactive
Loading the interactive chart…
Customers and suppliers named in filings
Buys from
- MLI · Stated in 10-K (named, share not stated) · source
- CC · Stated in 10-K (named, share not stated) · source
- REZI · Stated in 10-K (named, share not stated) · source
About Watsco
Watsco, Inc. and its subsidiaries (collectively, “Watsco,” the “Company”, or “we,” “us,” or “our ” ) was incorporated in Florida in 1956 and is the largest distributor of air conditioning, heating and refrigeration equipment and related parts and supplies (“HVAC/R”) in the HVAC/R distribution industry in North America. At December 31, 2025, we operated from 695 locations in 43 U.S. States, Canada, Mexico and Puerto Rico with additional market coverage on an export basis to portions of Latin America and the Caribbean, through which we serve more than 130,000 active contractors that service the replacement and new construction markets.
In its own words, from its 10-K, filed Feb 27, 2026.
Watsco against its Wholesale-Hardware & Plumbing & Heating Equipment & Supplies peers
The largest companies of the same SEC industry, each at its latest quarter.
| Company | Quarter | Revenue | Y/Y | Op. margin |
|---|---|---|---|---|
| WSO Watsco | Q3 2026 | $2.2B | +7% | 10.1% |
| FERG Ferguson Enterprises | Q2 2026 | $8.8B | +5% | 10.2% |
Source: Watsco 10-Q on SEC EDGAR · CIK 105016 · Wholesale-Hardware & Plumbing & Heating Equipment & Supplies
Guidance and outlook
13F: who owns WSO and who is buying
More on WSO
History
Every quarter: Q3 2026 results · Q2 2026 results · Q1 2026 results · Q4 2025 results · Q3 2025 results · Q2 2025 results · Q1 2025 results