Filing Flows › Industrials › Ferguson Enterprises (FERG)
Ferguson Enterprises (FERG) earnings and revenue breakdown
Latest: Q2 2026 · 10-Q filed Aug 10, 2026 · Ferguson Enterprises (FERG) Q2 2026 earnings results →
Q2 2026 Revenue up 5% year over year to $8.8B · 8¢ of every $1 of revenue kept as net profit · operating margin 10.2%
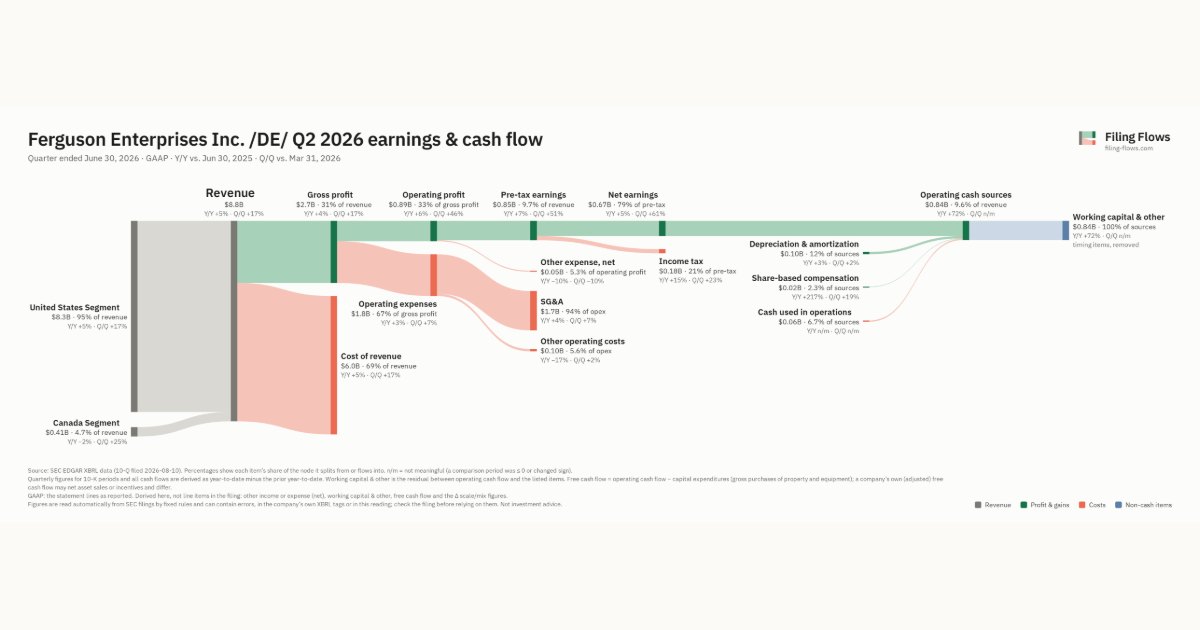
Ferguson Enterprises made $8.8B in Q2 2026 (+5% Y/Y): United States Segment $8.3B, Canada Segment $408M. Operating margin 10.2%, net earnings $666M. See where every dollar goes — costs, profit and cash — as a Sankey from the 10-Q filed Aug 10, 2026.
Drawing the Sankey…
Open the interactive Sankey → click any line for what the company wrote about it, compare Y/Y and Q/Q, export as PNG or PDF
What changed this quarter
Revenue was $8.8B in Q2 2026, up 5% year over year and up 17% from the previous quarter. United States Segment was the largest line at 95% of revenue. United States Segment added $0.40B year over year (up 5%), 102% of the total change. Canada Segment declined 2%.
Gross margin was 31.0%, down 0.3 points from a year earlier. Operating profit was $0.89B, a 10.2% margin (up 0.1 points year over year). Of the extra revenue versus a year earlier, 13% reached operating profit, above the 10% margin then. Operating expenses grew 3% against revenue growth of 5%. Net earnings were $0.67B, up 5% year over year. The effective tax rate was 21.3%.
Operating cash flow was −$0.06B. Non-cash charges added back $0.10B of depreciation and amortization and $0.02B of share-based compensation. Working capital and other items used $0.84B. Capital expenditures of $0.14B exceeded it, leaving free cash flow of −$0.20B.
Quarterly history
| Quarter | Form | Filed | Revenue | Y/Y | Op. margin | Net earnings | Op. cash flow |
|---|---|---|---|---|---|---|---|
| Q2 2026 | 10-Q | Aug 10, 2026 | $8.8B | +5% | 10.2% | $666M | −$56.0M |
| Q1 2026 | 10-Q | May 5, 2026 | $7.5B | +4% | 8.2% | $414M | $772M |
| Q3 2025 | 10-Q | Dec 9, 2025 | $8.2B | +5% | 9.4% | $570M | $430M |
| Q2 2025 | 10-K | Sep 26, 2025 | $8.5B | +7% | 10.9% | $700M | $541M |
| Q1 2025 | 10-Q | Jun 3, 2025 | $7.6B | +4% | 8.0% | $410M | $682M |
| Q1 2025 | 10-Q | Mar 11, 2025 | $6.9B | +3% | 6.0% | $276M | $340M |
| Q2 2024 | 10-K | Sep 25, 2024 | $7.9B | — | 10.2% | $451M | $366M |
Charts
Interactive views
The same charts as the app — open one to draw it.
💵Where each $1 goesinteractive
Loading the interactive chart…
🌏Named in Asian annual reportsinteractive
Loading the interactive chart…
🔄Rotation against the market and its industry (RRG)interactive
Loading the interactive chart…
🔍Earnings qualityinteractive
Loading the interactive chart…
⚖️Fair value by methodinteractive
Loading the interactive chart…
🔭Outlook & guidanceinteractive
Loading the interactive chart…
📈Investments: gains and what it boughtinteractive
Loading the interactive chart…
🏭Its industry’s money flow (input-output)interactive
Loading the interactive chart…
Customers and suppliers named in filings
Buys from
About Ferguson Enterprises
Ferguson is the largest value-added distributor serving the water and air specialized professional in our $340 billion residential and non-residential North American construction market. We help make our customers’ complex projects simple, successful and sustainable by providing expertise and a wide range of products and services from plumbing, heating, ventilation and air conditioning (“HVAC”), appliances, and lighting to pipes, valves and fittings (“PVF”), water and wastewater solutions and more. We sell through a common network of distribution centers, branches, counter service and expert sales associates, showroom consultants and e-commerce channels.
In its own words, from its 10-K, filed Sep 26, 2025.
Ferguson Enterprises against its Wholesale-Hardware & Plumbing & Heating Equipment & Supplies peers
The largest companies of the same SEC industry, each at its latest quarter.
| Company | Quarter | Revenue | Y/Y | Op. margin |
|---|---|---|---|---|
| FERG Ferguson Enterprises | Q2 2026 | $8.8B | +5% | 10.2% |
| WSO Watsco | Q3 2026 | $2.2B | +7% | 10.1% |
Source: Ferguson Enterprises 10-Q on SEC EDGAR · CIK 2011641 · Wholesale-Hardware & Plumbing & Heating Equipment & Supplies
Guidance and outlook
13F: who owns FERG and who is buying
More on FERG
- How Ferguson Enterprises makes money: revenue by segment
- Ferguson Enterprises next earnings date and what analysts expect
- Ferguson Enterprises stock forecast, price target and fair value
- Who owns Ferguson Enterprises stock: holders, funds and Congress trades
- Ferguson Enterprises guidance and outlook
- Ferguson Enterprises recalls, complaints and regulation
History
Every quarter: Q2 2026 results · Q1 2026 results · Q3 2025 results · Q2 2025 results · Q1 2025 results · Q1 2025 results · Q2 2024 results
- Ferguson Enterprises gross margin by quarter
- Ferguson Enterprises operating margin by quarter
- Ferguson Enterprises net income by quarter
- Ferguson Enterprises free cash flow by quarter
- Ferguson Enterprises capital expenditures by quarter
- Ferguson Enterprises United States Segment revenue by quarter
- Ferguson Enterprises Canada Segment revenue by quarter