Filing Flows › Technology › IonQ (IONQ)
IonQ (IONQ) earnings and revenue breakdown
Latest: Q3 2026 · 10-Q filed Nov 5, 2026 · IonQ (IONQ) Q3 2026 earnings results →
Q3 2026 Revenue up 336% year over year to $174M · 324¢ of every $1 of revenue kept as net profit · operating margin -249.1%
IonQ made $174M in Q3 2026 (+336% Y/Y): CMOS Foundry $53.8M, Quantum Hardware $52.9M, Quantum Services $37.4M. Operating margin -249.1%, net earnings $563M. See where every dollar goes — costs, profit and cash — as a Sankey from the 10-Q filed Nov 5, 2026.
Drawing the Sankey…
Open the interactive Sankey → click any line for what the company wrote about it, compare Y/Y and Q/Q, export as PNG or PDF
What changed this quarter
Revenue was $173.8M in Q3 2026, up 336% year over year and up 117% from the previous quarter. CMOS Foundry was the largest line at 31% of revenue. Quantum Hardware added $31.4M year over year (up 145%), 23% of the total change.
Operating costs exceeded revenue by $433.1M, an operating margin of -249.1%. Total costs grew 191% against revenue growth of 336%. The fastest-growing cost line was Cost of revenue (+539%). Net earnings were $564.0M ($563.1M including minority interests, which bore $843K of losses). The effective tax rate was -33.6%. Non-operating items added $854.5M, 203% of pre-tax earnings, so the bottom line overstates operating performance.
Operating cash flow was −$315.5M. Non-cash charges added back $127.6M of depreciation and amortization and $146.9M of share-based compensation. Working capital and other items used $1,153.2M. Capital expenditures of $16.3M exceeded it, leaving free cash flow of −$331.9M.
Quarterly history
| Quarter | Form | Filed | Revenue | Y/Y | Op. margin | Net earnings | Op. cash flow |
|---|---|---|---|---|---|---|---|
| Q3 2026 | 10-Q | Nov 5, 2026 | $174M | +336% | -249.1% | $563M | −$316M |
| Q2 2026 | 10-Q | Aug 10, 2026 | $80.0M | +287% | -421.3% | −$1.9B | −$104M |
| Q1 2026 | 10-Q | May 7, 2026 | $64.7M | +755% | -419.8% | $805M | −$151M |
| Q4 2025 | 10-K | Feb 25, 2026 | $61.9M | +428% | -369.4% | $753M | −$74.5M |
| Q3 2025 | 10-Q | Nov 5, 2025 | $39.9M | +222% | -423.5% | −$1.1B | −$123M |
| Q2 2025 | 10-Q | Aug 6, 2025 | $20.7M | +82% | -776.0% | −$178M | −$52.6M |
| Q1 2025 | 10-Q | May 7, 2025 | $7.6M | -0.2% | n/m | −$32.3M | −$33.0M |
Charts
In supply chains and themes
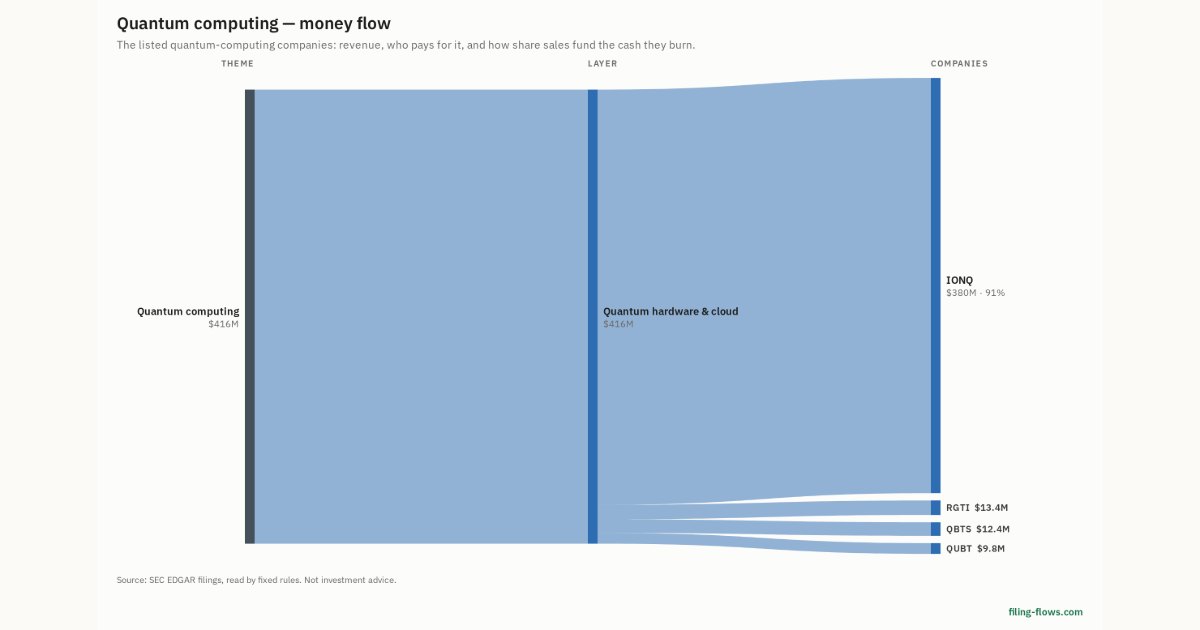
Interactive views
The same charts as the app — open one to draw it.
💵Where each $1 goesinteractive
Loading the interactive chart…
🌏Named in Asian annual reportsinteractive
Loading the interactive chart…
🔄Rotation against the market and its industry (RRG)interactive
Loading the interactive chart…
🔍Earnings qualityinteractive
Loading the interactive chart…
⚖️Fair value by methodinteractive
Loading the interactive chart…
🔭Outlook & guidanceinteractive
Loading the interactive chart…
📈Investments: gains and what it boughtinteractive
Loading the interactive chart…
🏭Its industry’s money flow (input-output)interactive
Loading the interactive chart…
About IonQ
IonQ is the world’s first and only quantum platform company. We operate in every theater: in space, in the air, on land and at sea, where we seek to deliver the full promise of quantum, across computing, networking, sensing and security. We believe that we have the clearest path to fault-tolerant quantum computing, and a repertoire of networking, sensing and security products that will form the backbone of a global quantum infrastructure. We are developing quantum computers designed to solve some of the world’s most complex problems and transform business, society and the planet for the better. We believe that our proprietary technology, our architecture and the technology exclusively available to us through license agreements will offer us advantages both in research and development and in the commercial value of our product offerings.
In its own words, from its 10-K, filed Feb 25, 2026.
IonQ against its Services-Computer Integrated Systems Design peers
The largest companies of the same SEC industry, each at its latest quarter. Revenue growth: +336% against the peers' median +4%. Operating margin: -249.1% against the peers' median 10.0%.
| Company | Quarter | Revenue | Y/Y | Op. margin |
|---|---|---|---|---|
| IONQ IonQ | Q3 2026 | $174M | +336% | -249.1% |
| LDOS Leidos Holdings | Q3 2026 | $4.6B | +4% | 11.9% |
| KD Kyndryl Holdings | Q2 FY27 | $3.7B | -2% | 3.1% |
| CACI CACI International | Q3 2026 | $2.5B | +8% | 10.0% |
| SAIC Science Applications International | Q2 FY27 | $1.9B | +6% | 8.1% |
| PSN Parsons | Q3 2026 | $1.7B | +2% | 6.3% |
| GDDY GoDaddy | Q3 2026 | $1.3B | +6% | 27.0% |
| OTEX Open Text | Q1 FY27 | $1.2B | -4% | 20.3% |
| LAWIL Light & Wonder | Q3 2026 | $824M | -2% | 29.4% |
Source: IonQ 10-Q on SEC EDGAR · CIK 1824920 · Services-Computer Integrated Systems Design
Guidance and outlook
13F: who owns IONQ and who is buying
More on IONQ
History
Every quarter: Q3 2026 results · Q2 2026 results · Q1 2026 results · Q4 2025 results · Q3 2025 results · Q2 2025 results · Q1 2025 results