Filing Flows › Technology › CACI International (CACI)
CACI International (CACI) earnings and revenue breakdown
Latest: Q3 2026 · 10-Q filed Oct 22, 2026 · CACI International (CACI) Q3 2026 earnings results →
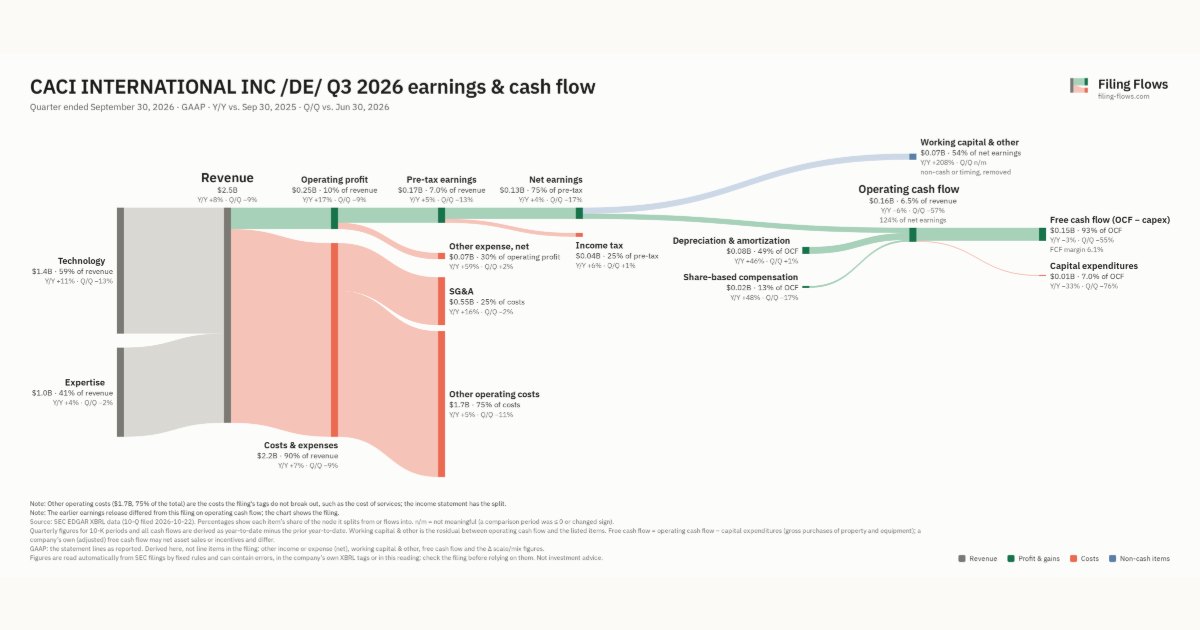
Q3 2026 Revenue up 8% year over year to $2.5B · 5¢ of every $1 of revenue kept as net profit · operating margin 10.0%
CACI International made $2.5B in Q3 2026 (+8% Y/Y): Technology $1.4B, Expertise $1.0B. Operating margin 10.0%, net earnings $130M. See where every dollar goes — costs, profit and cash — as a Sankey from the 10-Q filed Oct 22, 2026.
Drawing the Sankey…
Open the interactive Sankey → click any line for what the company wrote about it, compare Y/Y and Q/Q, export as PNG or PDF
What changed this quarter
Revenue was $2.5B in Q3 2026, up 8% year over year and down 9% from the previous quarter. Technology was the largest line at 59% of revenue. Technology added $0.15B year over year (up 11%), 79% of the total change.
Operating profit was $0.25B, a 10.0% margin (up 0.7 points year over year). Of the extra revenue versus Q3 2025, 19% reached operating profit, above the 9% margin then. Total costs grew 7% against revenue growth of 8%. The fastest-growing cost line was SG&A (+16%). Net earnings were $0.13B, up 4% year over year. The effective tax rate was 25.2%.
Operating cash flow was $0.16B (down 6% year over year), 124% of net earnings. Non-cash charges added back $0.08B of depreciation and amortization and $0.02B of share-based compensation. Working capital and other items used $0.07B. Capital expenditures of $0.01B left free cash flow of $0.15B.
Quarterly history
| Quarter | Form | Filed | Revenue | Y/Y | Op. margin | Net earnings | Op. cash flow |
|---|---|---|---|---|---|---|---|
| Q3 2026 | 10-Q | Oct 22, 2026 | $2.5B | +8% | 10.0% | $130M | $161M |
| Q2 2026 | 10-K | Aug 6, 2026 | $2.7B | +18% | 10.0% | $157M | $378M |
| Q1 2026 | 10-Q | Apr 23, 2026 | $2.4B | +8% | 9.7% | $130M | $183M |
| Q4 2025 | 10-Q | Jan 22, 2026 | $2.2B | +6% | 9.3% | $124M | $154M |
| Q3 2025 | 10-Q | Oct 23, 2025 | $2.3B | +11% | 9.3% | $125M | $171M |
| Q2 2025 | 10-K | Aug 7, 2025 | $2.3B | +13% | 9.0% | $158M | $156M |
| Q1 2025 | 10-Q | Apr 24, 2025 | $2.2B | +12% | 9.1% | $112M | $230M |
Charts
In supply chains and themes
Interactive views
The same charts as the app — open one to draw it.
💵Where each $1 goesinteractive
Loading the interactive chart…
🌏Named in Asian annual reportsinteractive
Loading the interactive chart…
🔄Rotation against the market and its industry (RRG)interactive
Loading the interactive chart…
🔍Earnings qualityinteractive
Loading the interactive chart…
⚖️Fair value by methodinteractive
Loading the interactive chart…
🔭Outlook & guidanceinteractive
Loading the interactive chart…
📈Investments: gains and what it boughtinteractive
Loading the interactive chart…
🏭Its industry’s money flow (input-output)interactive
Loading the interactive chart…
Customers and suppliers named in filings
Sells to
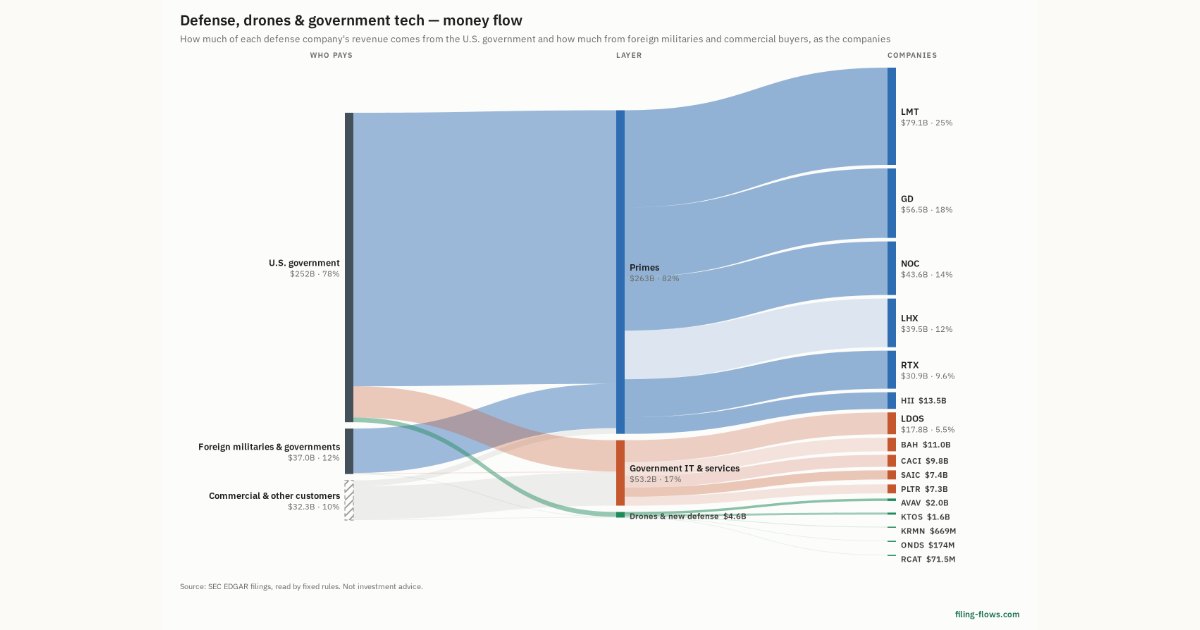
- U.S. government — 96% of its revenue · Stated in 10-K (sentence) · source
- usgov · named in a filing
About CACI International
CACI International Inc (CACI), a Delaware corporation, is a holding company whose operations are conducted through subsidiaries primarily located in the U.S. and Europe. CACI was founded in 1962 as a simulation technology company and has grown into a leading provider of differentiated Technology and distinctive Expertise to customers in support of national security in the intelligence, defense, and federal civilian sectors, both domestically and internationally. Unless the context indicates otherwise, the terms “CACI,” the “Company,” “we,” “us,” and “our,” refer to CACI International Inc and its subsidiaries and joint ventures that are majority-owned or otherwise controlled by it. The term “the Registrant” refers to CACI International Inc only.
In its own words, from its 10-K, filed Aug 6, 2026.
CACI International against its Services-Computer Integrated Systems Design peers
The largest companies of the same SEC industry, each at its latest quarter. Revenue growth: +8% against the peers' median +4%. Operating margin: 10.0% against the peers' median 11.9%.
| Company | Quarter | Revenue | Y/Y | Op. margin |
|---|---|---|---|---|
| CACI CACI International | Q3 2026 | $2.5B | +8% | 10.0% |
| LDOS Leidos Holdings | Q3 2026 | $4.6B | +4% | 11.9% |
| KD Kyndryl Holdings | Q2 FY27 | $3.7B | -2% | 3.1% |
| SAIC Science Applications International | Q2 FY27 | $1.9B | +6% | 8.1% |
| PSN Parsons | Q3 2026 | $1.7B | +2% | 6.3% |
| GDDY GoDaddy | Q3 2026 | $1.3B | +6% | 27.0% |
| OTEX Open Text | Q1 FY27 | $1.2B | -4% | 20.3% |
| LAWIL Light & Wonder | Q3 2026 | $824M | -2% | 29.4% |
| JKHY Jack Henry & Associates | Q1 FY27 | $702M | +9% | 29.5% |
Source: CACI International 10-Q on SEC EDGAR · CIK 16058 · Services-Computer Integrated Systems Design
13F: who owns CACI and who is buying
More on CACI
History
Every quarter: Q3 2026 results · Q2 2026 results · Q1 2026 results · Q4 2025 results · Q3 2025 results · Q2 2025 results · Q1 2025 results