Filing Flows › Financials › Invesco (IVZ)
Invesco (IVZ) earnings and revenue breakdown
Latest: Q3 2026 · 10-Q filed Nov 3, 2026 · Invesco (IVZ) Q3 2026 earnings results →
Q3 2026 Revenue up 14% year over year to $1.9B · 16¢ of every $1 of revenue kept as net profit · operating margin 23.3%
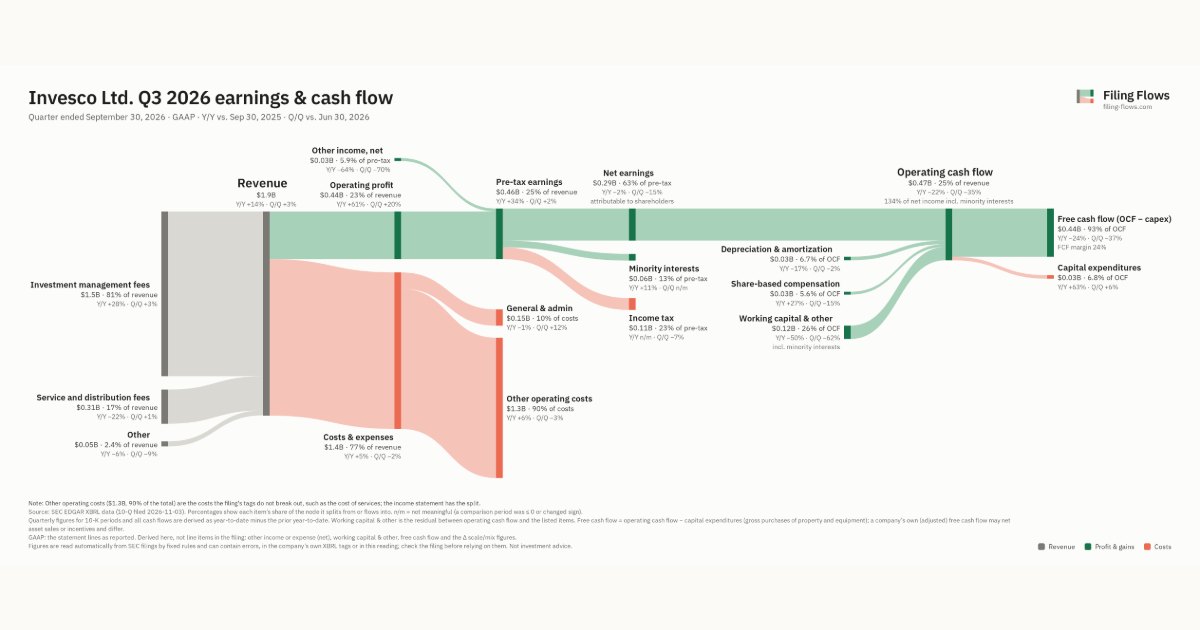
Invesco made $1.9B in Q3 2026 (+14% Y/Y): Investment management fees $1.5B, Service and distribution fees $313M, Other $45.8M. Operating margin 23.3%, net earnings $294M. See where every dollar goes — costs, profit and cash — as a Sankey from the 10-Q filed Nov 3, 2026.
Drawing the Sankey…
Open the interactive Sankey → click any line for what the company wrote about it, compare Y/Y and Q/Q, export as PNG or PDF
What changed this quarter
Revenue was $1.9B in Q3 2026, up 14% year over year and up 3% from the previous quarter. Investment management fees was the largest line at 81% of revenue. Investment management fees added $0.33B year over year (up 28%), 141% of the total change. Service and distribution fees declined 22%.
Operating profit was $0.44B, a 23.3% margin (up 6.8 points year over year). Of the extra revenue versus Q3 2025, 71% reached operating profit, above the 17% margin then. Total costs grew 5% against revenue growth of 14%. Net earnings were $0.29B, down 2% year over year. The effective tax rate was 23.3%.
Operating cash flow was $0.47B (down 22% year over year), 134% of net income including minority interests. Non-cash charges added back $0.03B of depreciation and amortization and $0.03B of share-based compensation. Working capital and other items added $0.06B. Capital expenditures of $0.03B left free cash flow of $0.44B.
Quarterly history
| Quarter | Form | Filed | Revenue | Y/Y | Op. margin | Net earnings | Op. cash flow |
|---|---|---|---|---|---|---|---|
| Q3 2026 | 10-Q | Nov 3, 2026 | $1.9B | +14% | 23.3% | $294M | $475M |
| Q2 2026 | 10-Q | Aug 4, 2026 | $1.8B | +20% | 19.9% | $345M | $734M |
| Q1 2026 | 10-Q | May 5, 2026 | $1.7B | +14% | 19.1% | $230M | $213M |
| Q4 2025 | 10-K | Feb 24, 2026 | $1.7B | +6% | -86.2% | −$996M | $456M |
| Q3 2025 | 10-Q | Nov 4, 2025 | $1.6B | +8% | 16.5% | $301M | $606M |
| Q2 2025 | 10-Q | Aug 1, 2025 | $1.5B | +2% | 14.1% | $197M | $548M |
| Q1 2025 | 10-Q | Apr 28, 2025 | $1.5B | +4% | 18.1% | $171M | −$84.6M |
Charts
Interactive views
The same charts as the app — open one to draw it.
💵Where each $1 goesinteractive
Loading the interactive chart…
🌏Named in Asian annual reportsinteractive
Loading the interactive chart…
🔄Rotation against the market and its industry (RRG)interactive
Loading the interactive chart…
🔍Earnings qualityinteractive
Loading the interactive chart…
⚖️Fair value by methodinteractive
Loading the interactive chart…
🔭Outlook & guidanceinteractive
Loading the interactive chart…
📈Investments: gains and what it boughtinteractive
Loading the interactive chart…
🏭Its industry’s money flow (input-output)interactive
Loading the interactive chart…
Customers and suppliers named in filings
Sells to
- Invesco Real Estate Income Trust Inc. · Stated in 10-K (named, share not stated) · source
About Invesco
Invesco Ltd. (the Parent), along with its consolidated entities (collectively, Invesco or the company), is an independent investment management firm dedicated to delivering a superior investment experience. Our comprehensive range of active, passive and alternative investment capabilities has been constructed over many years to help clients achieve their investment objectives. We draw on this comprehensive range of capabilities to provide solutions designed to deliver key outcomes aligned to client needs. With approximately 7,500 employees and an on-the-ground presence in more than 20 countries, Invesco is well positioned to meet the needs of investors across the globe. We have specialized investment teams managing investments across a broad range of asset classes, investment styles and geographies.
In its own words, from its 10-K, filed Feb 24, 2026.
Invesco against its Investment Advice peers
The largest companies of the same SEC industry, each at its latest quarter. Revenue growth: +14% against the peers' median +6%. Operating margin: 23.3% against the peers' median 24.0%.
| Company | Quarter | Revenue | Y/Y | Op. margin |
|---|---|---|---|---|
| IVZ Invesco | Q3 2026 | $1.9B | +14% | 23.3% |
| KKR KKR | Q2 2026 | $5.7B | +12% | 24.0% |
| AMP Ameriprise Financial | Q3 2026 | $5.2B | +6% | 28.9% |
| APO Apollo Global Management | Q3 2026 | $4.7B | -52% | -30.9% |
| BX Blackstone | Q3 2026 | $3.1B | -0.8% | 46.9% |
| BEN Franklin Templeton | Q4 FY26 | $2.4B | +4% | 14.6% |
| TROW Price T Rowe Group | Q3 2026 | $2.0B | +6% | 38.4% |
| BAM Brookfield Asset Management | Q2 2026 | $1.8B | +61% | 62.4% |
| ARES Ares Management | Q3 2026 | $1.3B | +9% | 13.1% |
Source: Invesco 10-Q on SEC EDGAR · CIK 914208 · Investment Advice
Guidance and outlook
More on IVZ
History
Every quarter: Q3 2026 results · Q2 2026 results · Q1 2026 results · Q4 2025 results · Q3 2025 results · Q2 2025 results · Q1 2025 results