Filing Flows › Financials › Franklin Templeton (BEN)
Franklin Templeton (BEN) earnings and revenue breakdown
Latest: Q4 FY26 · 8-K filed Nov 6, 2026
Q4 FY26 Revenue up 4% year over year to $2.4B · 16¢ of every $1 of revenue kept as net profit · operating margin 14.6%
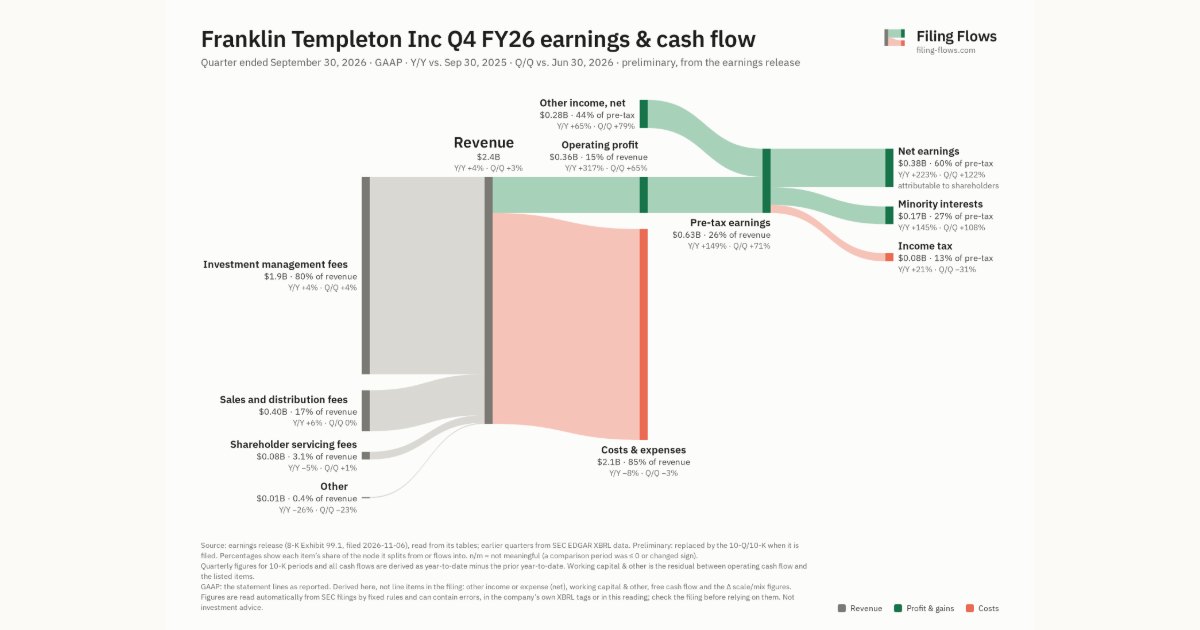
Franklin Templeton made $2.4B in Q4 FY26 (+4% Y/Y): Investment management fees $1.9B, Sales and distribution fees $404M, Shareholder servicing fees $75.2M. Operating margin 14.6%, net earnings $380M. See where every dollar goes — costs, profit and cash — as a Sankey from the 8-K filed Nov 6, 2026 (preliminary, from the earnings release).
Drawing the Sankey…
Open the interactive Sankey → click any line for what the company wrote about it, compare Y/Y and Q/Q, export as PNG or PDF
What changed this quarter
Revenue was $2.4B in Q4 FY26, up 4% year over year and up 3% from the previous quarter. Investment management fees was the largest line at 80% of revenue. Investment management fees added $0.08B year over year (up 4%), 85% of the total change. Other declined 26%.
Operating profit was $0.36B, a 14.6% margin (up 11.0 points year over year). Of the extra revenue versus Q4 FY25, 296% reached operating profit, above the 4% margin then. Total costs fell 8% while revenue rose 4%. Net earnings were $0.38B, up 223% year over year. The effective tax rate was 12.6%. Non-operating items added $0.28B, 44% of pre-tax earnings, so the bottom line overstates operating performance.
Quarterly history
| Quarter | Form | Filed | Revenue | Y/Y | Op. margin | Net earnings | Op. cash flow |
|---|---|---|---|---|---|---|---|
| Q4 FY26 | 8-K | Nov 6, 2026 | $2.4B | +4% | 14.6% | $380M | — |
| Q3 FY26 | 10-Q | Jul 31, 2026 | $2.4B | +14% | 9.2% | $172M | $581M |
| Q2 FY26 | 10-Q | Apr 28, 2026 | $2.3B | +9% | 14.1% | $268M | −$27.6M |
| Q1 FY26 | 10-Q | Jan 30, 2026 | $2.3B | +3% | 12.1% | $256M | −$255M |
| Q4 FY25 | 10-K | Nov 10, 2025 | $2.3B | +6% | 3.6% | $118M | −$20.7M |
| Q3 FY25 | 10-Q | Aug 1, 2025 | $2.1B | -3% | 7.5% | $92.3M | $1.3B |
| Q2 FY25 | 10-Q | May 2, 2025 | $2.1B | -2% | 6.9% | $151M | −$50.1M |
Charts
Interactive views
The same charts as the app — open one to draw it.
💵Where each $1 goesinteractive
Loading the interactive chart…
🌏Named in Asian annual reportsinteractive
Loading the interactive chart…
🔄Rotation against the market and its industry (RRG)interactive
Loading the interactive chart…
🔍Earnings qualityinteractive
Loading the interactive chart…
⚖️Fair value by methodinteractive
Loading the interactive chart…
🔭Outlook & guidanceinteractive
Loading the interactive chart…
📈Investments: gains and what it boughtinteractive
Loading the interactive chart…
🏭Its industry’s money flow (input-output)interactive
Loading the interactive chart…
Customers and suppliers named in filings
Sells to
- FBRT · Stated in 10-K (named, share not stated) · source
- Franklin BSP Real Estate Debt, Inc. · Stated in 10-K (named, share not stated) · source
About Franklin Templeton
Franklin Resources, Inc. (“Franklin”) is a holding company with subsidiaries operating under our Franklin Templeton® and/or subsidiary brand names. Franklin’s common stock is traded on the New York Stock Exchange (the “NYSE”) under the ticker symbol “BEN” and is included in the Standard & Poor’s 500 Index. In this Annual Report, Franklin and its subsidiaries are collectively referred to as the “Company,” and words such as “we,” “us,” “our” and similar terms refer to the Company. We have one operating segment, investment management and related services.
In its own words, from its 10-K, filed Nov 10, 2025.
Franklin Templeton against its Investment Advice peers
The largest companies of the same SEC industry, each at its latest quarter. Revenue growth: +4% against the peers' median +6%. Operating margin: 14.6% against the peers' median 24.0%.
| Company | Quarter | Revenue | Y/Y | Op. margin |
|---|---|---|---|---|
| BEN Franklin Templeton | Q4 FY26 | $2.4B | +4% | 14.6% |
| KKR KKR | Q2 2026 | $5.7B | +12% | 24.0% |
| AMP Ameriprise Financial | Q3 2026 | $5.2B | +6% | 28.9% |
| APO Apollo Global Management | Q3 2026 | $4.7B | -52% | -30.9% |
| BX Blackstone | Q3 2026 | $3.1B | -0.8% | 46.9% |
| TROW Price T Rowe Group | Q3 2026 | $2.0B | +6% | 38.4% |
| IVZ Invesco | Q3 2026 | $1.9B | +14% | 23.3% |
| BAM Brookfield Asset Management | Q2 2026 | $1.8B | +61% | 62.4% |
| ARES Ares Management | Q3 2026 | $1.3B | +9% | 13.1% |
Source: Franklin Templeton 8-K on SEC EDGAR · CIK 38777 · Investment Advice
13F: who owns BEN and who is buying
More on BEN
- How Franklin Templeton makes money: revenue by segment
- Franklin Templeton next earnings date and what analysts expect
- Franklin Templeton stock forecast, price target and fair value
- Who owns Franklin Templeton stock: holders, funds and Congress trades
- Is Franklin Templeton a takeover target? LBO and rumors
- Franklin Templeton recalls, complaints and regulation
History
Every quarter: Q4 FY26 results · Q3 FY26 results · Q2 FY26 results · Q1 FY26 results · Q4 FY25 results · Q3 FY25 results · Q2 FY25 results