Filing Flows › Industrials › Jetblue Airways (JBLU)
Jetblue Airways (JBLU) earnings and revenue breakdown
Latest: Q3 2026 · 10-Q filed Oct 26, 2026 · Jetblue Airways (JBLU) Q3 2026 earnings results →
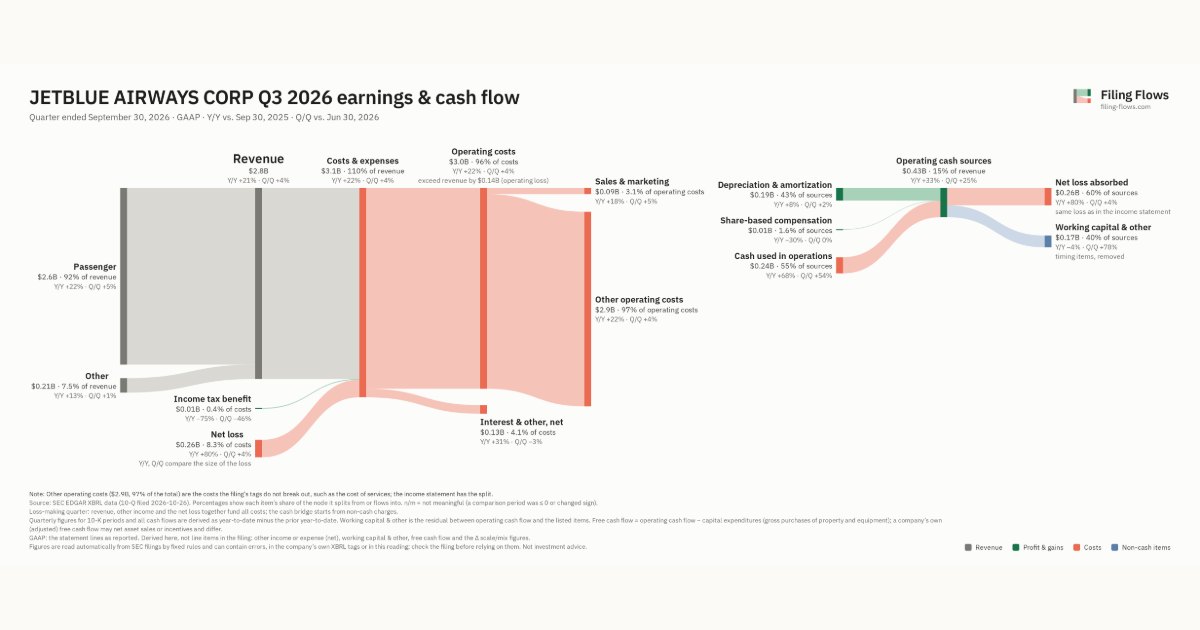
Q3 2026 Revenue up 21% year over year to $2.8B · 9¢ of every $1 of revenue lost · operating margin -5.1%
Jetblue Airways made $2.8B in Q3 2026 (+21% Y/Y): Passenger $2.6B, Other $212M. Operating margin -5.1%, net loss $257M. See where every dollar goes — costs, profit and cash — as a Sankey from the 10-Q filed Oct 26, 2026.
Drawing the Sankey…
Open the interactive Sankey → click any line for what the company wrote about it, compare Y/Y and Q/Q, export as PNG or PDF
What changed this quarter
Revenue was $2.8B in Q3 2026, up 21% year over year and up 4% from the previous quarter. Passenger was the largest line at 92% of revenue. Passenger added $0.47B year over year (up 22%), 95% of the total change.
Operating costs exceeded revenue by $0.14B, an operating margin of -5.1%. Total costs grew 22% against revenue growth of 21%. The fastest-growing cost line was Other operating costs (+22%). The quarter ended with a net loss of $0.26B, wider than the previous quarter's $0.25B loss.
Operating cash flow was −$0.24B. Non-cash charges added back $0.19B of depreciation and amortization and $0.01B of share-based compensation. Working capital and other items used $0.17B. Capital expenditures of $0.23B exceeded it, leaving free cash flow of −$0.47B.
Quarterly history
| Quarter | Form | Filed | Revenue | Y/Y | Op. margin | Net earnings | Op. cash flow |
|---|---|---|---|---|---|---|---|
| Q3 2026 | 10-Q | Oct 26, 2026 | $2.8B | +21% | -5.1% | −$257M | −$238M |
| Q2 2026 | 10-Q | Jul 28, 2026 | $2.7B | +14% | -5.2% | −$247M | −$155M |
| Q1 2026 | 10-Q | Apr 28, 2026 | $2.2B | +5% | -10.0% | −$319M | $120M |
| Q4 2025 | 10-K | Feb 12, 2026 | $2.2B | -1% | -4.5% | −$177M | $49.0M |
| Q3 2025 | 10-Q | Oct 28, 2025 | $2.3B | -2% | -4.3% | −$143M | −$142M |
| Q2 2025 | 10-Q | Jul 29, 2025 | $2.4B | -3% | 0.3% | −$74.0M | −$115M |
| Q1 2025 | 10-Q | Apr 29, 2025 | $2.1B | -3% | -8.1% | −$208M | $114M |
Charts
Interactive views
The same charts as the app — open one to draw it.
💵Where each $1 goesinteractive
Loading the interactive chart…
🌏Named in Asian annual reportsinteractive
Loading the interactive chart…
🔄Rotation against the market and its industry (RRG)interactive
Loading the interactive chart…
🔍Earnings qualityinteractive
Loading the interactive chart…
⚖️Fair value by methodinteractive
Loading the interactive chart…
🔭Outlook & guidanceinteractive
Loading the interactive chart…
📈Investments: gains and what it boughtinteractive
Loading the interactive chart…
🏭Its industry’s money flow (input-output)interactive
Loading the interactive chart…
About Jetblue Airways
JetBlue Airways Corporation is New York's Hometo wn Airline ® . As of December 31, 2025, JetBlue served 112 destinations across the United States, the Caribbean and Latin America, Canada and Europe. JetBlue was incorporated in Delaware in August 1998 and commenced service on February 11, 2000. We believe our differentiated product and culture combined with our competitive cost structure enable us to compete effectively in the high-value geographies we serve. Looking to the future, we plan to continue to grow in our high-value geographies, invest in industry-leading products, and provide award-winning service by our 23,000 dedicated employees, whom we refer to as crewmembers. Going forward, we believe we will continue to differentiate ourselves from other airlines, enabling us to continue to attract a greater mix of customers, and to drive continued growth.
In its own words, from its 10-K, filed Feb 12, 2026.
Jetblue Airways against its Air Transportation, Scheduled peers
The largest companies of the same SEC industry, each at its latest quarter. Revenue growth: +21% against the peers' median +19%. Operating margin: -5.1% against the peers' median 1.9%.
| Company | Quarter | Revenue | Y/Y | Op. margin |
|---|---|---|---|---|
| JBLU Jetblue Airways | Q3 2026 | $2.8B | +21% | -5.1% |
| DAL Delta Air Lines | Q3 2026 | $20.2B | +21% | 7.2% |
| United Airlines | Q3 2026 | $17.9B | +17% | 8.1% |
| AAL American Airlines Group | Q3 2026 | $16.3B | +19% | 0.7% |
| American Airlines | Q1 2025 | $12.6B | -0.2% | -2.2% |
| LUV Southwest Airlines | Q3 2026 | $8.4B | +21% | 4.5% |
| ALK Alaska Air Group | Q3 2026 | $4.3B | +14% | 1.9% |
| ULCC Frontier Group Holdings | Q3 2026 | $1.4B | +53% | -8.0% |
| SKYW Skywest | Q3 2026 | $1.1B | +6% | 15.8% |
Source: Jetblue Airways 10-Q on SEC EDGAR · CIK 1158463 · Air Transportation, Scheduled
13F: who owns JBLU and who is buying
More on JBLU
- How Jetblue Airways makes money: revenue by segment
- Jetblue Airways stock forecast, price target and fair value
- Who owns Jetblue Airways stock: holders, funds and Congress trades
- Jetblue Airways guidance and outlook
- Is Jetblue Airways a takeover target? LBO and rumors
- Jetblue Airways recalls, complaints and regulation
History
Every quarter: Q3 2026 results · Q2 2026 results · Q1 2026 results · Q4 2025 results · Q3 2025 results · Q2 2025 results · Q1 2025 results