Filing Flows › Industrials › Alaska Air Group (ALK)
Alaska Air Group (ALK) earnings and revenue breakdown
Latest: Q3 2026 · 10-Q filed Nov 6, 2026 · Alaska Air Group (ALK) Q3 2026 earnings results →
Q3 2026 Revenue up 14% year over year to $4.3B · 3¢ of every $1 of revenue lost · operating margin 1.9%
Alaska Air Group made $4.3B in Q3 2026 (+14% Y/Y). Operating margin 1.9%, net loss $147M. See where every dollar goes — costs, profit and cash — as a Sankey from the 10-Q filed Nov 6, 2026.
Drawing the Sankey…
Open the interactive Sankey → click any line for what the company wrote about it, compare Y/Y and Q/Q, export as PNG or PDF
What changed this quarter
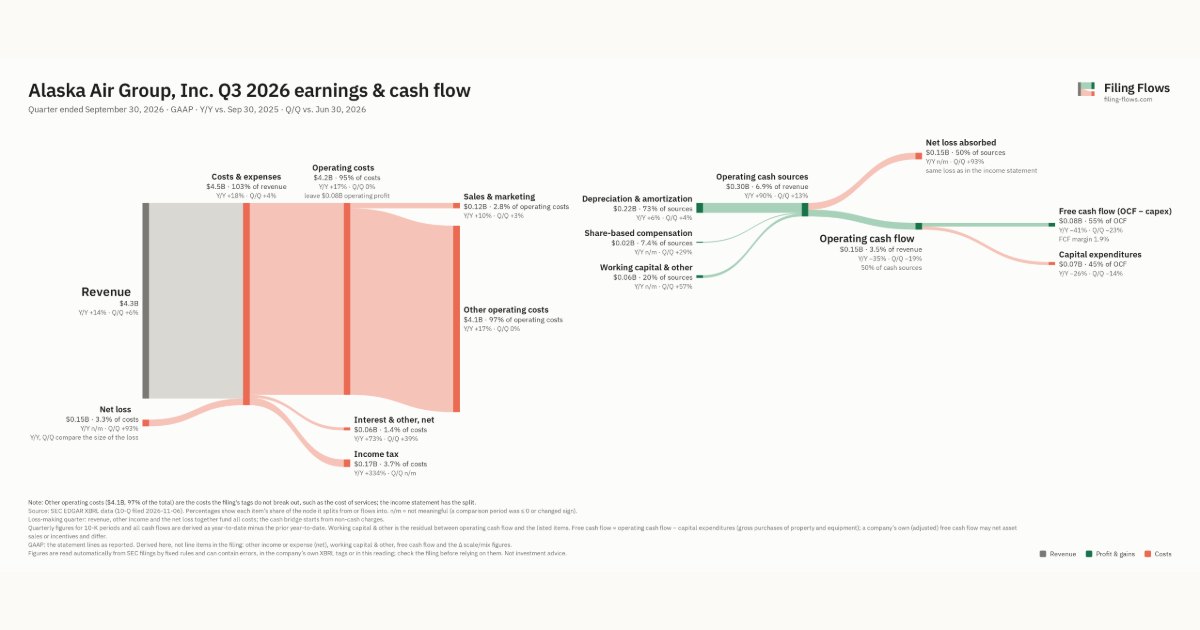
Revenue was $4.3B in Q3 2026, up 14% year over year and up 6% from the previous quarter.
Operating profit was $0.08B, a 1.9% margin (down 2.0 points year over year). Operating profit fell $0.07B even though revenue rose $0.54B versus Q3 2025, so costs grew faster than sales. Total costs grew 17% against revenue growth of 14%. The fastest-growing cost line was Other operating costs (+17%). The quarter ended with a net loss of $0.15B, wider than the previous quarter's $0.08B loss.
Operating cash flow was $0.15B (down 35% year over year). Non-cash charges added back $0.22B of depreciation and amortization and $0.02B of share-based compensation. Working capital and other items added $0.06B. Capital expenditures of $0.07B left free cash flow of $0.08B.
Quarterly history
| Quarter | Form | Filed | Revenue | Y/Y | Op. margin | Net earnings | Op. cash flow |
|---|---|---|---|---|---|---|---|
| Q3 2026 | 10-Q | Nov 6, 2026 | $4.3B | +14% | 1.9% | −$147M | $149M |
| Q2 2026 | 10-Q | Aug 4, 2026 | $4.1B | +10% | -4.1% | −$76.0M | $185M |
| Q1 2026 | 10-Q | May 7, 2026 | $3.3B | +5% | -8.5% | −$193M | $421M |
| Q4 2025 | 10-K | Feb 12, 2026 | $3.6B | +3% | 2.1% | $21.0M | $185M |
| Q3 2025 | 10-Q | Nov 6, 2025 | $3.8B | +23% | 3.9% | $73.0M | $229M |
| Q2 2025 | 10-Q | Aug 7, 2025 | $3.7B | +28% | 7.5% | $172M | $376M |
| Q1 2025 | 10-Q | May 8, 2025 | $3.1B | +40% | -6.3% | −$166M | $459M |
Charts
Interactive views
The same charts as the app — open one to draw it.
💵Where each $1 goesinteractive
Loading the interactive chart…
🌏Named in Asian annual reportsinteractive
Loading the interactive chart…
🔄Rotation against the market and its industry (RRG)interactive
Loading the interactive chart…
🔍Earnings qualityinteractive
Loading the interactive chart…
⚖️Fair value by methodinteractive
Loading the interactive chart…
🔭Outlook & guidanceinteractive
Loading the interactive chart…
📈Investments: gains and what it boughtinteractive
Loading the interactive chart…
🏭Its industry’s money flow (input-output)interactive
Loading the interactive chart…
About Alaska Air Group
In preparing these statements, the Company is required to make estimates and assumptions that affect the reported amounts of assets and liabilities and the disclosure of contingent liabilities, as well as the reported amounts of revenue and expenses, including impairment charges. Due to seasonal variations in the demand for air travel, the volatility of aircraft fuel prices, changes in global economic conditions, changes in the competitive environment, and other factors, operating results for the three and six months ended June 30, 2026 are not necessarily indicative of operating results for the entire year.
In its own words, from its 10-Q, filed Aug 4, 2026.
Alaska Air Group against its Air Transportation, Scheduled peers
The largest companies of the same SEC industry, each at its latest quarter. Revenue growth: +14% against the peers' median +19%. Operating margin: 1.9% against the peers' median 1.9%.
| Company | Quarter | Revenue | Y/Y | Op. margin |
|---|---|---|---|---|
| ALK Alaska Air Group | Q3 2026 | $4.3B | +14% | 1.9% |
| DAL Delta Air Lines | Q3 2026 | $20.2B | +21% | 7.2% |
| United Airlines | Q3 2026 | $17.9B | +17% | 8.1% |
| AAL American Airlines Group | Q3 2026 | $16.3B | +19% | 0.7% |
| American Airlines | Q1 2025 | $12.6B | -0.2% | -2.2% |
| LUV Southwest Airlines | Q3 2026 | $8.4B | +21% | 4.5% |
| JBLU Jetblue Airways | Q3 2026 | $2.8B | +21% | -5.1% |
| ULCC Frontier Group Holdings | Q3 2026 | $1.4B | +53% | -8.0% |
| SKYW Skywest | Q3 2026 | $1.1B | +6% | 15.8% |
Source: Alaska Air Group 10-Q on SEC EDGAR · CIK 766421 · Air Transportation, Scheduled
Guidance and outlook
13F: who owns ALK and who is buying
More on ALK
- How Alaska Air Group makes money: revenue by segment
- Alaska Air Group stock forecast, price target and fair value
- Who owns Alaska Air Group stock: holders, funds and Congress trades
- Alaska Air Group guidance and outlook
- Is Alaska Air Group a takeover target? LBO and rumors
- Alaska Air Group recalls, complaints and regulation
History
Every quarter: Q3 2026 results · Q2 2026 results · Q1 2026 results · Q4 2025 results · Q3 2025 results · Q2 2025 results · Q1 2025 results