Filing Flows › Materials › James Hardie Industries (JHX)
James Hardie Industries (JHX) earnings and revenue breakdown
Latest: Q2 FY27 · 10-Q filed Nov 5, 2026 · James Hardie Industries (JHX) Q2 FY27 earnings results →
Q2 FY27 Revenue up 24% year over year to $1.4B · 11¢ of every $1 of revenue kept as net profit · operating margin 18.4%
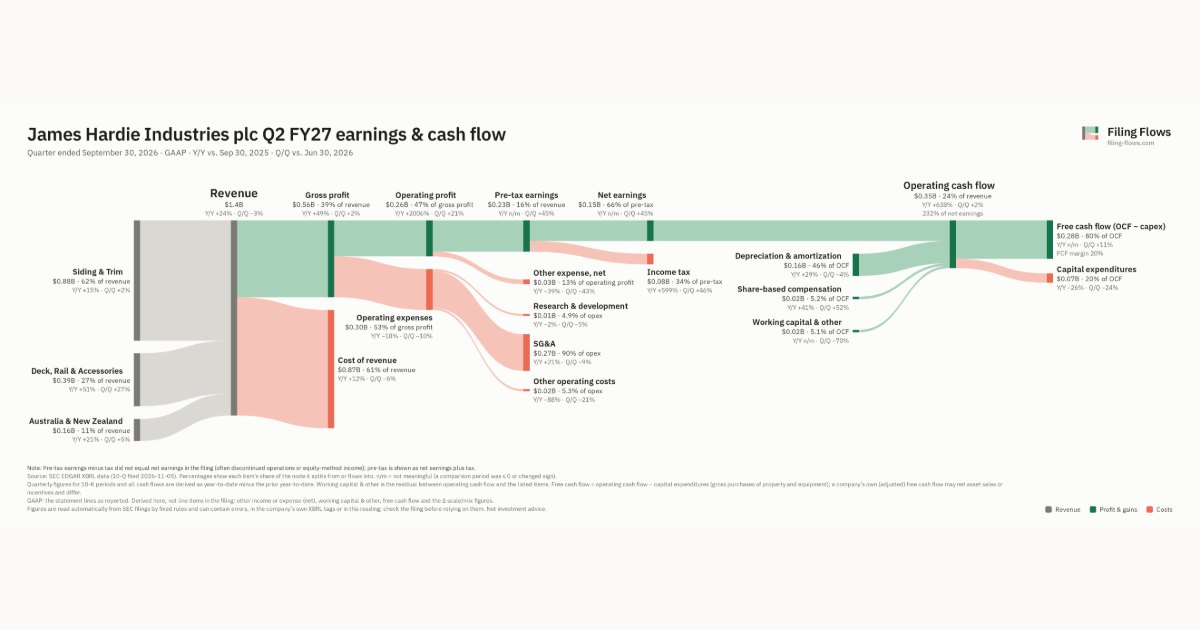
James Hardie Industries made $1.4B in Q2 FY27 (+24% Y/Y): Siding & Trim $880M, Deck, Rail & Accessories $387M, Australia & New Zealand $161M. Operating margin 18.4%, net earnings $151M. See where every dollar goes — costs, profit and cash — as a Sankey from the 10-Q filed Nov 5, 2026.
Drawing the Sankey…
Open the interactive Sankey → click any line for what the company wrote about it, compare Y/Y and Q/Q, export as PNG or PDF
What changed this quarter
Revenue was $1.4B in Q2 FY27, up 24% year over year and down 3% from the previous quarter. Siding & Trim was the largest line at 62% of revenue. Deck, Rail & Accessories added $0.13B year over year (up 51%), 48% of the total change.
Gross margin was 39.4%, up 6.6 points from a year earlier. Operating profit was $0.26B, a 18.4% margin (up 17.4 points year over year). Of the extra revenue versus a year earlier, 92% reached operating profit, above the 1% margin then. Operating expenses fell 18% while revenue rose 24%. The fastest-growing cost line was SG&A (+21%). Net earnings were $0.15B. The effective tax rate was 33.9%.
Operating cash flow was $0.35B (up 638% year over year), 232% of net earnings. Non-cash charges added back $0.16B of depreciation and amortization and $0.02B of share-based compensation. Working capital and other items added $0.02B. Capital expenditures of $0.07B left free cash flow of $0.28B.
Quarterly history
| Quarter | Form | Filed | Revenue | Y/Y | Op. margin | Net earnings | Op. cash flow |
|---|---|---|---|---|---|---|---|
| Q2 FY27 | 10-Q | Nov 5, 2026 | $1.4B | +24% | 18.4% | $151M | $350M |
| Q1 FY27 | 10-Q | Aug 6, 2026 | $1.5B | +64% | 14.8% | $104M | $344M |
Charts
Interactive views
The same charts as the app — open one to draw it.
💵Where each $1 goesinteractive
Loading the interactive chart…
🌏Named in Asian annual reportsinteractive
Loading the interactive chart…
🔄Rotation against the market and its industry (RRG)interactive
Loading the interactive chart…
🔍Earnings qualityinteractive
Loading the interactive chart…
⚖️Fair value by methodinteractive
Loading the interactive chart…
🔭Outlook & guidanceinteractive
Loading the interactive chart…
📈Investments: gains and what it boughtinteractive
Loading the interactive chart…
🏭Its industry’s money flow (input-output)interactive
Loading the interactive chart…
About James Hardie Industries
Except as the context otherwise may require, references in this Annual Report on Form 10-K (this “Annual Report”) to “James Hardie,” the “James Hardie Group,” the “Company,” “JHI plc,” “we,” “our” or “us” refer to James Hardie Industries plc, together with its direct and indirect wholly owned subsidiaries as of the time relevant to the applicable reference. The term “fiscal year” refers to our fiscal year ended March 31 of such year; the term “$” refers to US dollars; the term “A$” refers to Australian dollars; and the term “€” refers to Euros.
In its own words, from its 10-K, filed May 19, 2026.
James Hardie Industries against its Concrete Products, Except Block & Brick peers
The largest companies of the same SEC industry, each at its latest quarter. Revenue growth: +24% against the peers' median +24%. Operating margin: 18.4% against the peers' median 8.5%.
| Company | Quarter | Revenue | Y/Y | Op. margin |
|---|---|---|---|---|
| JHX James Hardie Industries | Q2 FY27 | $1.4B | +24% | 18.4% |
| RMIX Suncrete | Q2 2026 | $97.2M | +146% | -9.0% |
| SMID Smith Midland | Q2 2026 | $23.4M | -11% | 8.5% |
Source: James Hardie Industries 10-Q on SEC EDGAR · CIK 1159152 · Concrete Products, Except Block & Brick
Guidance and outlook
More on JHX
- How James Hardie Industries makes money: revenue by segment
- James Hardie Industries next earnings date and what analysts expect
- James Hardie Industries stock forecast, price target and fair value
- James Hardie Industries guidance and outlook
- Is James Hardie Industries a takeover target? LBO and rumors
- James Hardie Industries recalls, complaints and regulation
History
Every quarter: Q2 FY27 results · Q1 FY27 results