Filing Flows › Industrials › Lennar (LEN)
Lennar (LEN) earnings and revenue breakdown
Latest: Q3 FY26 · 10-Q filed Oct 2, 2026 · Lennar (LEN) Q3 FY26 earnings results →
Q3 FY26 Revenue down 9% year over year to $8.0B · 4¢ of every $1 of revenue kept as net profit · operating margin 5.7%
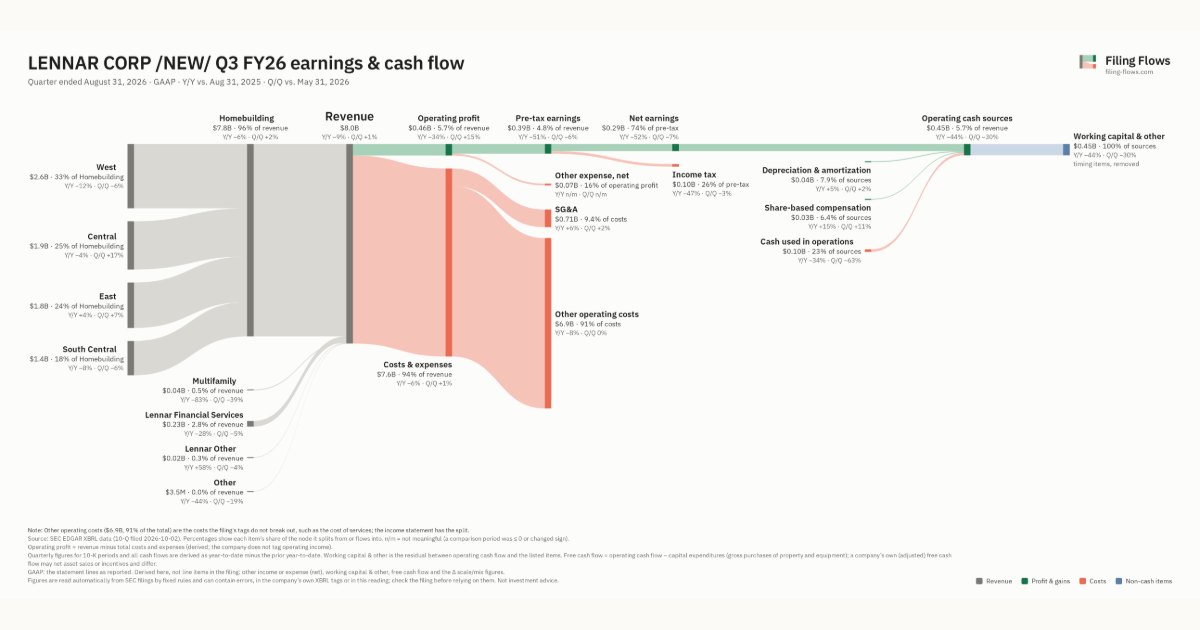
Lennar made $8.0B in Q3 FY26 (-9% Y/Y): Homebuilding $7.8B, Lennar Financial Services $226M, Multifamily $38.5M. Operating margin 5.7%, net earnings $284M. See where every dollar goes — costs, profit and cash — as a Sankey from the 10-Q filed Oct 2, 2026.
Drawing the Sankey…
Open the interactive Sankey → click any line for what the company wrote about it, compare Y/Y and Q/Q, export as PNG or PDF
What changed this quarter
Revenue was $8.0B in Q3 FY26, down 9% year over year and up 1% from the previous quarter. West was the largest line at 32% of revenue. West lost $0.37B year over year (down 12%), 48% of the total change.
Operating profit was $0.46B, a 5.7% margin (down 2.2 points year over year). Total costs fell 6% while revenue fell 9%. Net earnings were $0.28B, down 52% year over year. The effective tax rate was 26.2%.
Operating cash flow was −$0.10B. Non-cash charges added back $0.04B of depreciation and amortization and $0.03B of share-based compensation. Working capital and other items used $0.45B. Capital expenditures of −$0.01B exceeded it, leaving free cash flow of −$0.10B.
Quarterly history
| Quarter | Form | Filed | Revenue | Y/Y | Op. margin | Net earnings | Op. cash flow |
|---|---|---|---|---|---|---|---|
| Q3 FY26 | 10-Q | Oct 2, 2026 | $8.0B | -9% | 5.7% | $284M | −$104M |
| Q2 FY26 | 10-Q | Jun 29, 2026 | $7.9B | -5% | 5.0% | $308M | −$284M |
| Q1 FY26 | 10-Q | Apr 9, 2026 | $6.6B | -13% | 3.3% | $229M | −$434M |
| Q4 FY25 | 10-K | Jan 28, 2026 | $9.4B | -6% | 6.9% | $490M | $1.8B |
| Q3 FY25 | 10-Q | Oct 3, 2025 | $8.8B | -6% | 7.9% | $591M | −$159M |
| Q2 FY25 | 10-Q | Jul 1, 2025 | $8.4B | -4% | 7.5% | $477M | −$1.1B |
| Q4 FY24 | 10-K | Jan 23, 2025 | $9.9B | -9% | 13.7% | $1.1B | $975M |
Charts
Interactive views
The same charts as the app — open one to draw it.
💵Where each $1 goesinteractive
Loading the interactive chart…
🌏Named in Asian annual reportsinteractive
Loading the interactive chart…
🔄Rotation against the market and its industry (RRG)interactive
Loading the interactive chart…
🔍Earnings qualityinteractive
Loading the interactive chart…
⚖️Fair value by methodinteractive
Loading the interactive chart…
🔭Outlook & guidanceinteractive
Loading the interactive chart…
📈Investments: gains and what it boughtinteractive
Loading the interactive chart…
🏭Its industry’s money flow (input-output)interactive
Loading the interactive chart…
About Lennar
We are one of the largest homebuilders in the United States by deliveries, revenues and net earnings, an originator of residential and commercial mortgage loans, a provider of title insurance and closing services and a developer of multifamily rental properties. In addition, we are a sponsor and manager of funds and joint ventures engaged in development and ownership of multifamily rental properties and a sponsor and manager of a fund engaged in ownership of single-family rental properties. We also have investments in companies that are engaged in applying technology to improve the homebuilding industry and real estate related aspects of the financial services industry.
In its own words, from its 10-K, filed Jan 28, 2026.
Lennar against its General Bldg Contractors - Residential Bldgs peers
The largest companies of the same SEC industry, each at its latest quarter. Revenue growth: -9% against the peers' median +4%. Operating margin: 5.7% against the peers' median 11.3%.
| Company | Quarter | Revenue | Y/Y | Op. margin |
|---|---|---|---|---|
| LEN Lennar | Q3 FY26 | $8.0B | -9% | 5.7% |
| IBP Installed Building Products | Q3 2026 | $808M | +4% | 11.3% |
| GEO GEO Group | Q3 2026 | $761M | +12% | 13.5% |
Source: Lennar 10-Q on SEC EDGAR · CIK 920760 · General Bldg Contractors - Residential Bldgs
Guidance and outlook
13F: who owns LEN and who is buying
More on LEN
History
Every quarter: Q3 FY26 results · Q2 FY26 results · Q1 FY26 results · Q4 FY25 results · Q3 FY25 results · Q2 FY25 results · Q4 FY24 results