Filing Flows › Industrials › LKQ (LKQ)
LKQ (LKQ) earnings and revenue breakdown
Latest: Q3 2026 · 10-Q filed Oct 29, 2026 · LKQ (LKQ) Q3 2026 earnings results →
Q3 2026 Revenue down 5% year over year to $3.3B · 1¢ of every $1 of revenue lost · operating margin 1.6%
LKQ made $3.3B in Q3 2026 (-5% Y/Y): Europe $1.5B, North America Segment $1.4B, Specialty $465M. Operating margin 1.6%, net loss $27.0M. See where every dollar goes — costs, profit and cash — as a Sankey from the 10-Q filed Oct 29, 2026.
Drawing the Sankey…
Open the interactive Sankey → click any line for what the company wrote about it, compare Y/Y and Q/Q, export as PNG or PDF
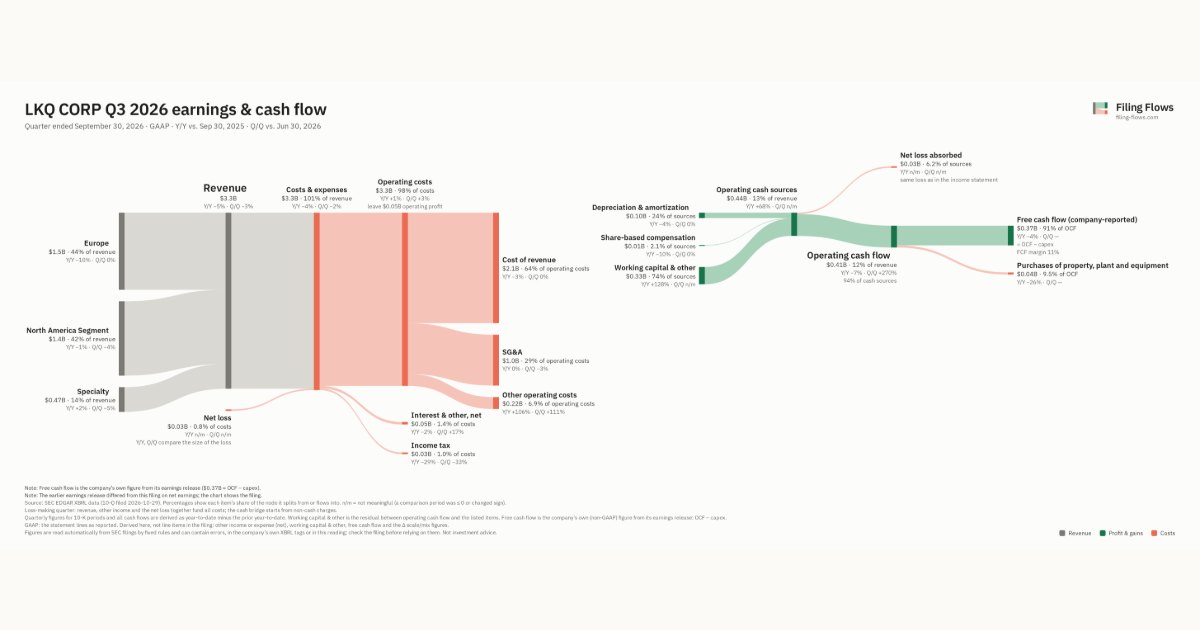
What changed this quarter
Revenue was $3.3B in Q3 2026, down 5% year over year and down 3% from the previous quarter. Europe was the largest line at 44% of revenue. Europe lost $0.17B year over year (down 10%), 93% of the total change.
Gross margin was 37.2%, down 1.1 points from Q3 2025. Operating profit was $0.05B, a 1.6% margin (down 6.2 points year over year). Operating expenses grew 11% against a revenue fall of 5%. The fastest-growing cost line was Other operating costs (+106%). The quarter ended with a net loss of $0.03B, after a profit of $0.14B the previous quarter. Net interest and other expense of $0.05B was the main reason.
Operating cash flow was $0.41B (down 7% year over year). Non-cash charges added back $0.10B of depreciation and amortization and $0.01B of share-based compensation. Working capital and other items added $0.33B. After purchases of property, plant and equipment ($0.04B), free cash flow as the company reports it was $0.37B.
Quarterly history
| Quarter | Form | Filed | Revenue | Y/Y | Op. margin | Net earnings | Op. cash flow |
|---|---|---|---|---|---|---|---|
| Q3 2026 | 10-Q | Oct 29, 2026 | $3.3B | -5% | 1.6% | −$27.0M | $411M |
| Q2 2026 | 10-Q | Jul 30, 2026 | $3.4B | -3% | 6.6% | $136M | $111M |
| Q1 2026 | 10-Q | Apr 30, 2026 | $3.5B | +4% | 6.3% | $79.0M | −$56.0M |
| Q4 2025 | 10-K | Feb 19, 2026 | $3.3B | +3% | 4.6% | $66.0M | $330M |
| Q3 2025 | 10-Q | Oct 30, 2025 | $3.5B | +1% | 7.8% | $180M | $440M |
| Q2 2025 | 10-Q | Jul 24, 2025 | $3.5B | -5% | 8.5% | $193M | $296M |
| Q1 2025 | 10-Q | Apr 24, 2025 | $3.3B | -10% | 8.6% | $169M | −$3.0M |
Charts
Interactive views
The same charts as the app — open one to draw it.
💵Where each $1 goesinteractive
Loading the interactive chart…
🌏Named in Asian annual reportsinteractive
Loading the interactive chart…
🔄Rotation against the market and its industry (RRG)interactive
Loading the interactive chart…
🔍Earnings qualityinteractive
Loading the interactive chart…
⚖️Fair value by methodinteractive
Loading the interactive chart…
🔭Outlook & guidanceinteractive
Loading the interactive chart…
📈Investments: gains and what it boughtinteractive
Loading the interactive chart…
🏭Its industry’s money flow (input-output)interactive
Loading the interactive chart…
About LKQ
LKQ Corporation ("LKQ," the "Company" or "we") is a global distributor of vehicle products, including replacement parts, components and systems used in the repair and maintenance of vehicles, and specialty aftermarket products and accessories to improve the performance, functionality and appearance of vehicles. Buyers of vehicle replacement products have the option to purchase from primarily four sources: new products produced by original equipment manufacturers ("OEMs"); new products produced by companies other than the OEMs, which are referred to as aftermarket products; salvaged products taken from total loss vehicles; and reconditioned products that have been refurbished or remanufactured. Collectively, we refer to the three sources that are not new OEM products as alternative parts.
In its own words, from its 10-K, filed Feb 19, 2026.
LKQ against its Wholesale-Motor Vehicles & Motor Vehicle Parts & Supplies peers
The largest companies of the same SEC industry, each at its latest quarter.
| Company | Quarter | Revenue | Y/Y | Op. margin |
|---|---|---|---|---|
| LKQ LKQ | Q3 2026 | $3.3B | -5% | 1.6% |
| CTNT Cheetah Net Supply Chain Service | Q2 2026 | $869K | +145% | -101.5% |
Source: LKQ 10-Q on SEC EDGAR · CIK 1065696 · Wholesale-Motor Vehicles & Motor Vehicle Parts & Supplies
13F: who owns LKQ and who is buying
More on LKQ
History
Every quarter: Q3 2026 results · Q2 2026 results · Q1 2026 results · Q4 2025 results · Q3 2025 results · Q2 2025 results · Q1 2025 results