Filing Flows › Financials › LPL Financial Holdings (LPLA)
LPL Financial Holdings (LPLA) earnings and revenue breakdown
Latest: Q3 2026 · 10-Q filed Oct 29, 2026 · LPL Financial Holdings (LPLA) Q3 2026 earnings results →
Q3 2026 Revenue up 17% year over year to $5.3B · 7¢ of every $1 of revenue kept as net profit · operating margin 9.1%
LPL Financial Holdings made $5.3B in Q3 2026 (+17% Y/Y). Operating margin 9.1%, net earnings $357M. See where every dollar goes — costs, profit and cash — as a Sankey from the 10-Q filed Oct 29, 2026.
Drawing the Sankey…
Open the interactive Sankey → click any line for what the company wrote about it, compare Y/Y and Q/Q, export as PNG or PDF
What changed this quarter
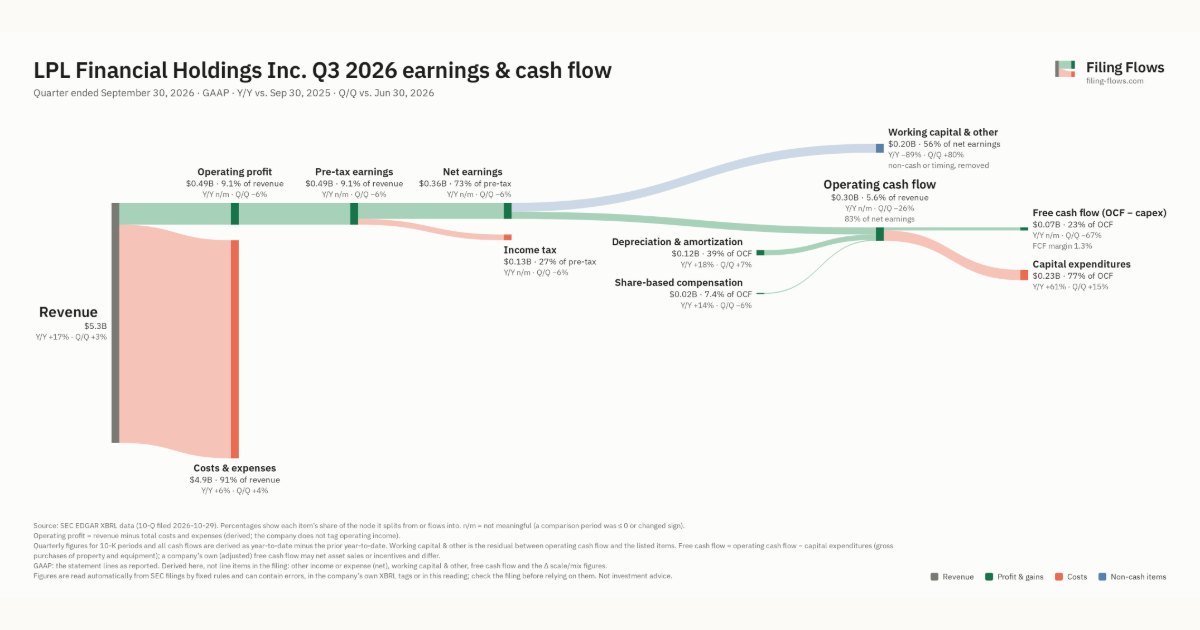
Revenue was $5.3B in Q3 2026, up 17% year over year and up 3% from the previous quarter.
Operating profit was $0.49B, a 9.1% margin (up 9.8 points year over year). Total costs grew 6% against revenue growth of 17%. Net earnings were $0.36B. The effective tax rate was 26.5%.
Operating cash flow was $0.30B, 83% of net earnings. Non-cash charges added back $0.12B of depreciation and amortization and $0.02B of share-based compensation. Working capital and other items used $0.20B. Capital expenditures of $0.23B left free cash flow of $0.07B.
Quarterly history
| Quarter | Form | Filed | Revenue | Y/Y | Op. margin | Net earnings | Op. cash flow |
|---|---|---|---|---|---|---|---|
| Q3 2026 | 10-Q | Oct 29, 2026 | $5.3B | +17% | 9.1% | $357M | $297M |
| Q2 2026 | 10-Q | Aug 3, 2026 | $5.2B | +35% | 9.9% | $379M | $402M |
| Q1 2026 | 10-Q | May 4, 2026 | $4.9B | +35% | 9.8% | $356M | $290M |
| Q4 2025 | 10-K | Feb 23, 2026 | $4.9B | +40% | 8.1% | $301M | $785M |
| Q3 2025 | 10-Q | Nov 3, 2025 | $4.6B | +46% | -0.7% | −$29.5M | −$1.7B |
| Q2 2025 | 10-Q | Aug 4, 2025 | $3.8B | +31% | 9.6% | $273M | $193M |
| Q1 2025 | 10-Q | May 9, 2025 | $3.7B | +30% | 11.4% | $319M | $340M |
Charts
Interactive views
The same charts as the app — open one to draw it.
💵Where each $1 goesinteractive
Loading the interactive chart…
🌏Named in Asian annual reportsinteractive
Loading the interactive chart…
🔄Rotation against the market and its industry (RRG)interactive
Loading the interactive chart…
🔍Earnings qualityinteractive
Loading the interactive chart…
⚖️Fair value by methodinteractive
Loading the interactive chart…
🔭Outlook & guidanceinteractive
Loading the interactive chart…
📈Investments: gains and what it boughtinteractive
Loading the interactive chart…
🏭Its industry’s money flow (input-output)interactive
Loading the interactive chart…
About LPL Financial Holdings
LPL serves the financial advisor-mediated marketplace as the nation’s largest independent broker-dealer, a leading investment advisory firm, and a top custodian. We support more than 32,000 financial advisors, and the wealth management practices of approximately 1,200 financial institutions, servicing and custodying approximately $2.4 trillion in brokerage and advisory assets. The firm provides a wide range of advisor affiliation models, investment solutions, fintech tools and practice management services, ensuring that advisors and institutions have the flexibility to choose the business model, services, and technology resources they need to run successful businesses.
In its own words, from its 10-K, filed Feb 23, 2026.
LPL Financial Holdings against its Security & Commodity Brokers, Dealers, Exchanges & Services peers
The largest companies of the same SEC industry, each at its latest quarter. Revenue growth: +17% against the peers' median +17%. Operating margin: 9.1% against the peers' median 30.6%.
| Company | Quarter | Revenue | Y/Y | Op. margin |
|---|---|---|---|---|
| LPLA LPL Financial Holdings | Q3 2026 | $5.3B | +17% | 9.1% |
| SNEX StoneX Group | Q3 FY26 | $40.2B | +15% | 0.4% |
| ICE Intercontinental Exchange | Q3 2026 | $3.6B | +21% | 38.8% |
| NDAQ Nasdaq | Q3 2026 | $2.4B | +21% | 30.6% |
| CME CME Group | Q3 2026 | $1.7B | +13% | 65.7% |
| CBOE Cboe Global Markets | Q3 2026 | $1.4B | +19% | 39.3% |
| BGC BGC Group | Q3 2026 | $833M | +13% | 11.8% |
| TW Tradeweb Markets | Q3 2026 | $585M | +15% | 43.4% |
| TOP TOP Financial Group | Q2 FY27 | $2.2M | +44% | 12.4% |
Source: LPL Financial Holdings 10-Q on SEC EDGAR · CIK 1397911 · Security & Commodity Brokers, Dealers, Exchanges & Services
Guidance and outlook
13F: who owns LPLA and who is buying
More on LPLA
History
Every quarter: Q3 2026 results · Q2 2026 results · Q1 2026 results · Q4 2025 results · Q3 2025 results · Q2 2025 results · Q1 2025 results