Filing Flows › Financials › StoneX Group (SNEX)
StoneX Group (SNEX) earnings and revenue breakdown
Latest: Q3 FY26 · 10-Q filed Aug 5, 2026 · StoneX Group (SNEX) Q3 FY26 earnings results →
Q3 FY26 Revenue up 15% year over year to $40.2B · 0¢ of every $1 of revenue kept as net profit · operating margin 0.4%
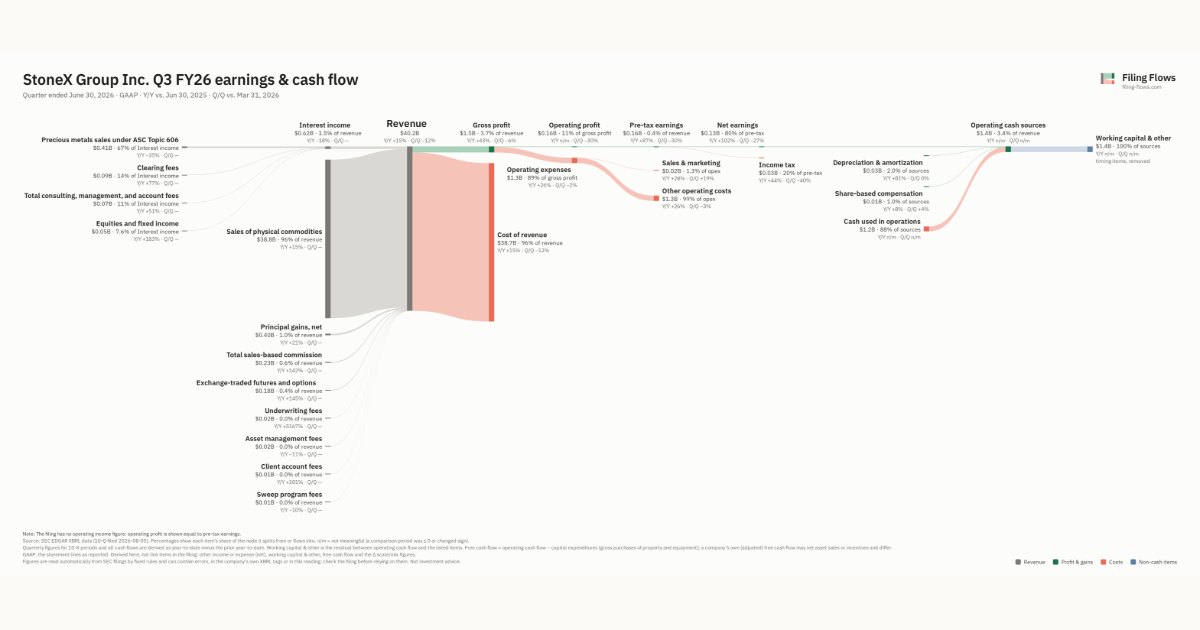
StoneX Group made $40.2B in Q3 FY26 (+15% Y/Y): Sales of physical commodities $38.8B, Interest income $616M, Principal gains, net $405M. Operating margin 0.4%, net earnings $128M. See where every dollar goes — costs, profit and cash — as a Sankey from the 10-Q filed Aug 5, 2026.
Drawing the Sankey…
Open the interactive Sankey → click any line for what the company wrote about it, compare Y/Y and Q/Q, export as PNG or PDF
What changed this quarter
Revenue was $40.2B in Q3 FY26, up 15% year over year and down 12% from the previous quarter. Sales of physical commodities was the largest line at 96% of revenue. Sales of physical commodities added $4.9B year over year (up 15%), 92% of the total change. Precious metals sales under ASC Topic 606 declined 35%.
Gross margin was 3.7%, up 0.7 points from Q3 FY25. Operating profit was $0.16B, a 0.4% margin (up 0.4 points year over year). Operating expenses grew 26% against revenue growth of 15%. The fastest-growing cost line was Sales & marketing (+28%). Net earnings were $0.13B, up 102% year over year. The effective tax rate was 20.0%.
Operating cash flow was −$1.2B. Non-cash charges added back $0.03B of depreciation and amortization and $0.01B of share-based compensation. Working capital and other items used $1.4B. Capital expenditures of $0.02B exceeded it, leaving free cash flow of −$1.2B.
Quarterly history
| Quarter | Form | Filed | Revenue | Y/Y | Op. margin | Net earnings | Op. cash flow |
|---|---|---|---|---|---|---|---|
| Q3 FY26 | 10-Q | Aug 5, 2026 | $40.2B | +15% | 0.4% | $128M | −$1.2B |
| Q2 FY26 | 10-Q | May 6, 2026 | $45.8B | +24% | 0.5% | $174M | $2.8B |
| Q1 FY26 | 10-Q | Feb 4, 2026 | $39.0B | +40% | 0.5% | $139M | −$1.3B |
| Q4 FY25 | 10-K | Nov 28, 2025 | $32.7B | +5% | 0.3% | $85.7M | $3.5B |
| Q3 FY25 | 10-Q | Aug 7, 2025 | $34.8B | +29% | 0.0% | $63.4M | $1.5B |
| Q2 FY25 | 10-Q | May 7, 2025 | $36.9B | +67% | 0.0% | $71.7M | −$154M |
| Q4 FY24 | 10-K | Nov 29, 2024 | $31.1B | +87% | 0.0% | $76.7M | $193M |
Charts
Interactive views
The same charts as the app — open one to draw it.
💵Where each $1 goesinteractive
Loading the interactive chart…
🌏Named in Asian annual reportsinteractive
Loading the interactive chart…
🔄Rotation against the market and its industry (RRG)interactive
Loading the interactive chart…
🔍Earnings qualityinteractive
Loading the interactive chart…
⚖️Fair value by methodinteractive
Loading the interactive chart…
🔭Outlook & guidanceinteractive
Loading the interactive chart…
📈Investments: gains and what it boughtinteractive
Loading the interactive chart…
🏭Its industry’s money flow (input-output)interactive
Loading the interactive chart…
About StoneX Group
We operate a global financial services network that connects companies, organizations, traders and investors to the global market ecosystem through a unique blend of digital platforms, end-to-end clearing and execution services, high touch service and deep expertise. We strive to be the one trusted partner to our clients, providing our network, products and services to allow them to pursue trading opportunities, manage their market risks, make investments and improve their business performance. Our businesses are supported by our global infrastructure of regulated operating subsidiaries, advanced technology platforms and team of more than 5,400 employees as of September 30, 2025.
In its own words, from its 10-K, filed Nov 28, 2025.
StoneX Group against its Security & Commodity Brokers, Dealers, Exchanges & Services peers
The largest companies of the same SEC industry, each at its latest quarter. Revenue growth: +15% against the peers' median +17%. Operating margin: 0.4% against the peers' median 30.6%.
| Company | Quarter | Revenue | Y/Y | Op. margin |
|---|---|---|---|---|
| SNEX StoneX Group | Q3 FY26 | $40.2B | +15% | 0.4% |
| LPLA LPL Financial Holdings | Q3 2026 | $5.3B | +17% | 9.1% |
| ICE Intercontinental Exchange | Q3 2026 | $3.6B | +21% | 38.8% |
| NDAQ Nasdaq | Q3 2026 | $2.4B | +21% | 30.6% |
| CME CME Group | Q3 2026 | $1.7B | +13% | 65.7% |
| CBOE Cboe Global Markets | Q3 2026 | $1.4B | +19% | 39.3% |
| BGC BGC Group | Q3 2026 | $833M | +13% | 11.8% |
| TW Tradeweb Markets | Q3 2026 | $585M | +15% | 43.4% |
| TOP TOP Financial Group | Q2 FY27 | $2.2M | +44% | 12.4% |
Source: StoneX Group 10-Q on SEC EDGAR · CIK 913760 · Security & Commodity Brokers, Dealers, Exchanges & Services
Guidance and outlook
13F: who owns SNEX and who is buying
More on SNEX
History
Every quarter: Q3 FY26 results · Q2 FY26 results · Q1 FY26 results · Q4 FY25 results · Q3 FY25 results · Q2 FY25 results · Q4 FY24 results
- StoneX Group gross margin by quarter
- StoneX Group operating margin by quarter
- StoneX Group net income by quarter
- StoneX Group free cash flow by quarter
- StoneX Group capital expenditures by quarter
- StoneX Group Sales of physical commodities revenue by quarter
- StoneX Group Principal gains, net revenue by quarter