Filing Flows › Financials › Molina Healthcare (MOH)
Molina Healthcare (MOH) earnings and revenue breakdown
Latest: Q3 2026 · 10-Q filed Oct 22, 2026 · Molina Healthcare (MOH) Q3 2026 earnings results →
Q3 2026 Revenue down 3% year over year to $11.1B · 0¢ of every $1 of revenue kept as net profit · operating margin 1.0%
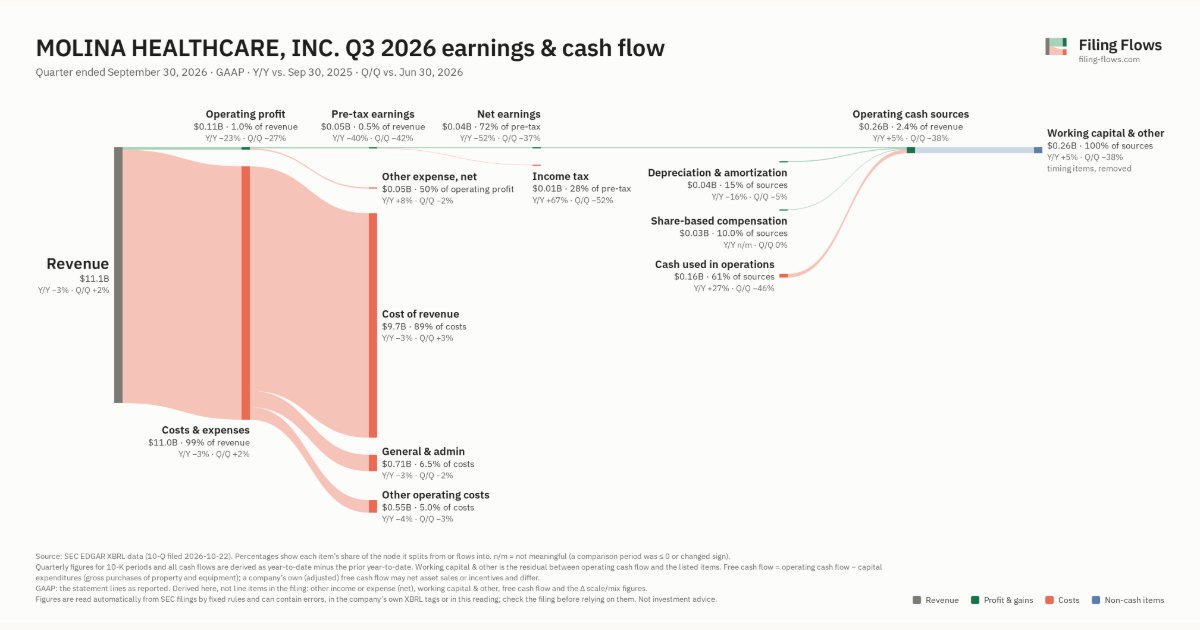
Molina Healthcare made $11.1B in Q3 2026 (-3% Y/Y). Operating margin 1.0%, net earnings $38.0M. See where every dollar goes — costs, profit and cash — as a Sankey from the 10-Q filed Oct 22, 2026.
Drawing the Sankey…
Open the interactive Sankey → click any line for what the company wrote about it, compare Y/Y and Q/Q, export as PNG or PDF
What changed this quarter
Revenue was $11.1B in Q3 2026, down 3% year over year and up 2% from the previous quarter.
Operating profit was $0.11B, a 1.0% margin (down 0.2 points year over year). Total costs fell 3% while revenue fell 3%. Net earnings were $0.04B, down 52% year over year. The effective tax rate was 28.3%.
Operating cash flow was −$0.16B. Non-cash charges added back $0.04B of depreciation and amortization and $0.03B of share-based compensation. Working capital and other items used $0.26B. Capital expenditures of $0.04B exceeded it, leaving free cash flow of −$0.20B.
Quarterly history
| Quarter | Form | Filed | Revenue | Y/Y | Op. margin | Net earnings | Op. cash flow |
|---|---|---|---|---|---|---|---|
| Q3 2026 | 10-Q | Oct 22, 2026 | $11.1B | -3% | 1.0% | $38.0M | −$159M |
| Q2 2026 | 10-Q | Jul 23, 2026 | $10.9B | -5% | 1.3% | $60.0M | −$294M |
| Q1 2026 | 10-Q | Apr 23, 2026 | $10.8B | -3% | 0.8% | $14.0M | $1.1B |
| Q4 2025 | 10-K | Feb 10, 2026 | $11.4B | +8% | -1.4% | −$160M | −$298M |
| Q3 2025 | 10-Q | Oct 23, 2025 | $11.5B | +11% | 1.2% | $79.0M | −$125M |
| Q2 2025 | 10-Q | Jul 24, 2025 | $11.4B | +16% | 3.3% | $255M | −$302M |
| Q1 2025 | 10-Q | Apr 24, 2025 | $11.1B | +12% | 3.9% | $298M | $190M |
Charts
Interactive views
The same charts as the app — open one to draw it.
💵Where each $1 goesinteractive
Loading the interactive chart…
🌏Named in Asian annual reportsinteractive
Loading the interactive chart…
🔄Rotation against the market and its industry (RRG)interactive
Loading the interactive chart…
🔍Earnings qualityinteractive
Loading the interactive chart…
⚖️Fair value by methodinteractive
Loading the interactive chart…
🔭Outlook & guidanceinteractive
Loading the interactive chart…
📈Investments: gains and what it boughtinteractive
Loading the interactive chart…
🏭Its industry’s money flow (input-output)interactive
Loading the interactive chart…
Customers and suppliers named in filings
Sells to
- Medicare & Medicaid — 13% of its revenue · Stated in 10-K (sentence) · source
Buys from
About Molina Healthcare
Molina Healthcare, Inc., a FORTUNE 500 company, provides managed healthcare services under the Medicaid and Medicare programs, and through the state insurance marketplaces (the “Marketplace”). Molina was founded in 1980 as a provider organization serving low-income families in Southern California and reincorporated in Delaware in 2002. We served approximately 5.5 million members as of December 31, 2025, located across 21 states. The Medicaid, Medicare, and Marketplace segments represent the government-funded or sponsored programs under which we offer managed healthcare services. The Other segment, which is insignificant to our consolidated results of operations, includes long-term services and supports consultative services in Wisconsin and the
In its own words, from its 10-K, filed Feb 10, 2026.
Molina Healthcare against its Hospital & Medical Service Plans peers
The largest companies of the same SEC industry, each at its latest quarter. Revenue growth: -3% against the peers' median +6%. Operating margin: 1.0% against the peers' median 1.0%.
| Company | Quarter | Revenue | Y/Y | Op. margin |
|---|---|---|---|---|
| MOH Molina Healthcare | Q3 2026 | $11.1B | -3% | 1.0% |
| UNH UnitedHealth Group | Q3 2026 | $112.7B | -0.4% | 5.8% |
| CI Cigna | Q3 2026 | $73.7B | +6% | 3.3% |
| ELV Elevance Health | Q3 2026 | $51.4B | +1% | 2.5% |
| CNC Centene | Q3 2026 | $50.6B | +2% | -0.6% |
| HUM Humana | Q3 2026 | $41.2B | +26% | 0.2% |
| OSCR Oscar Health | Q3 2026 | $5.1B | +72% | 3.5% |
| ALHC Alignment Healthcare | Q3 2026 | $1.4B | +37% | -0.3% |
| CLOV Clover Health Investments | Q3 2026 | $759M | +53% | 0.8% |
Source: Molina Healthcare 10-Q on SEC EDGAR · CIK 1179929 · Hospital & Medical Service Plans
Guidance and outlook
13F: who owns MOH and who is buying
More on MOH
History
Every quarter: Q3 2026 results · Q2 2026 results · Q1 2026 results · Q4 2025 results · Q3 2025 results · Q2 2025 results · Q1 2025 results