Filing Flows › Communication Services › News (NWSA)
News (NWSA) earnings and revenue breakdown
Latest: Q1 FY27 · 10-Q filed Nov 5, 2026 · News (NWSA) Q1 FY27 earnings results →
Q1 FY27 Revenue up 6% year over year to $2.3B · 7¢ of every $1 of revenue kept as net profit · operating margin 13.0%
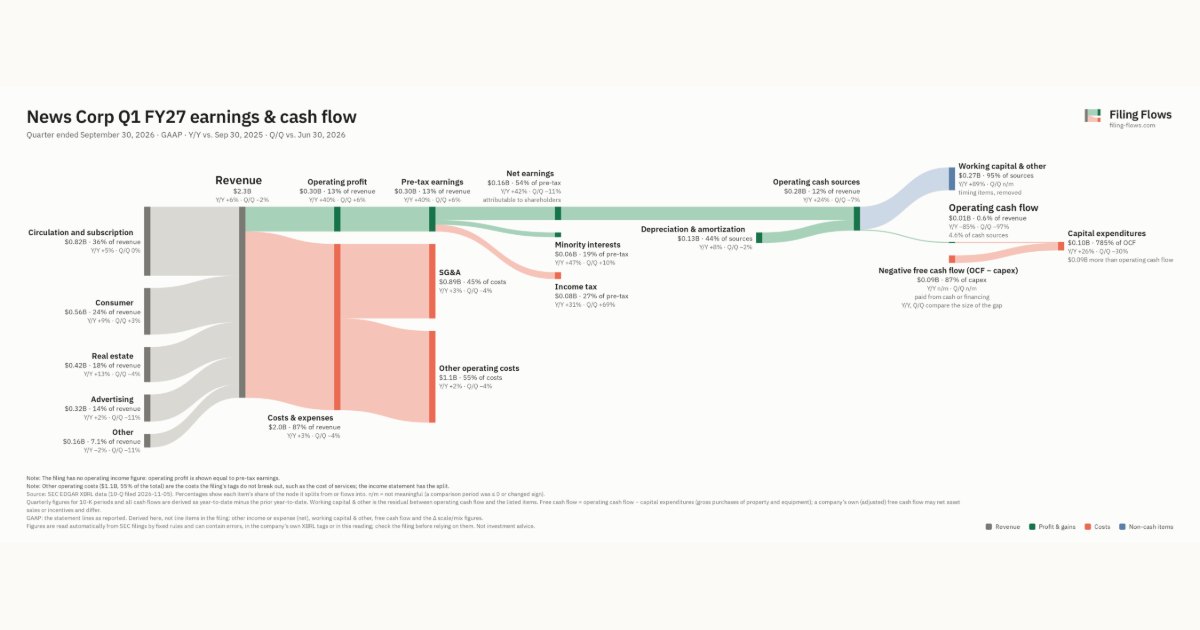
News made $2.3B in Q1 FY27 (+6% Y/Y): Circulation and subscription $823M, Consumer $556M, Real estate $418M. Operating margin 13.0%, net earnings $159M. See where every dollar goes — costs, profit and cash — as a Sankey from the 10-Q filed Nov 5, 2026.
Drawing the Sankey…
Open the interactive Sankey → click any line for what the company wrote about it, compare Y/Y and Q/Q, export as PNG or PDF
What changed this quarter
Revenue was $2.3B in Q1 FY27, up 6% year over year and down 2% from the previous quarter. Circulation and subscription was the largest line at 36% of revenue. Real estate added $0.05B year over year (up 13%), 35% of the total change. Other declined 2%.
Operating profit was $0.30B, a 13.0% margin (up 3.1 points year over year). Of the extra revenue versus Q1 FY26, 61% reached operating profit, above the 10% margin then. Total costs grew 3% against revenue growth of 6%. Net earnings were $0.16B, up 42% year over year. The effective tax rate was 27.4%.
Operating cash flow was $0.01B (down 85% year over year), 6% of net income including minority interests. Non-cash charges added back $0.13B of depreciation and amortization. Working capital and other items used $0.33B. Capital expenditures of $0.10B exceeded it, leaving free cash flow of −$0.09B.
Quarterly history
| Quarter | Form | Filed | Revenue | Y/Y | Op. margin | Net earnings | Op. cash flow |
|---|---|---|---|---|---|---|---|
| Q1 FY27 | 10-Q | Nov 5, 2026 | $2.3B | +6% | 13.0% | $159M | $13.0M |
| Q4 FY26 | 10-K | Aug 7, 2026 | $2.3B | +11% | 11.9% | $179M | $422M |
| Q3 FY26 | 10-Q | May 8, 2026 | $2.2B | +9% | 8.6% | $89.0M | $499M |
| Q2 FY26 | 10-Q | Feb 6, 2026 | $2.4B | +6% | 15.5% | $193M | $231M |
| Q1 FY26 | 10-Q | Nov 7, 2025 | $2.1B | +2% | 9.9% | $112M | $85.0M |
| Q4 FY25 | 10-K | Aug 6, 2025 | $2.1B | +0.8% | 39.0% | $743M | $189M |
| Q3 FY25 | 10-Q | May 9, 2025 | $2.0B | +0.8% | 9.0% | $103M | $511M |
Charts
Interactive views
The same charts as the app — open one to draw it.
💵Where each $1 goesinteractive
Loading the interactive chart…
🌏Named in Asian annual reportsinteractive
Loading the interactive chart…
🔄Rotation against the market and its industry (RRG)interactive
Loading the interactive chart…
🔍Earnings qualityinteractive
Loading the interactive chart…
⚖️Fair value by methodinteractive
Loading the interactive chart…
🔭Outlook & guidanceinteractive
Loading the interactive chart…
📈Investments: gains and what it boughtinteractive
Loading the interactive chart…
🏭Its industry’s money flow (input-output)interactive
Loading the interactive chart…
Customers and suppliers named in filings
Buys from
About News
News Corporation (the “Company,” “News Corp,” “we,” “us,” or “our”) is a global, diversified media and information services company focused on creating and distributing authoritative and engaging content and other products and services to consumers and businesses throughout the world. The Company comprises businesses across a range of media, including information services and news, digital real estate services and book publishing, that are distributed under some of the world’s most recognizable and respected brands, including The Wall Street Journal , Barron’s , Dow Jones, The Australian , Herald Sun , The Sun , The Times , HarperCollins Publishers, realestate.com.au, Realtor.com ® , talkSPORT and many others.
In its own words, from its 10-K, filed Aug 7, 2026.
News against its Newspapers: Publishing or Publishing & Printing peers
The largest companies of the same SEC industry, each at its latest quarter. Revenue growth: +6% against the peers' median +6%. Operating margin: 13.0% against the peers' median 13.0%.
| Company | Quarter | Revenue | Y/Y | Op. margin |
|---|---|---|---|---|
| NWSA News | Q1 FY27 | $2.3B | +6% | 13.0% |
| NYT New York Times | Q3 2026 | $769M | +10% | 15.9% |
| TDAY USA Today | Q3 2026 | $519M | -7% | -1.1% |
| LEE LEE Enterprises | Q3 FY26 | $126M | -11% | 6.9% |
| DJCO Daily Journal | Q3 FY26 | $27.0M | +15% | 19.5% |
Source: News 10-Q on SEC EDGAR · CIK 1564708 · Newspapers: Publishing or Publishing & Printing
Guidance and outlook
13F: who owns NWSA and who is buying
More on NWSA
History
Every quarter: Q1 FY27 results · Q4 FY26 results · Q3 FY26 results · Q2 FY26 results · Q1 FY26 results · Q4 FY25 results · Q3 FY25 results