Filing Flows › Technology › Ondas (ONDS)
Ondas (ONDS) earnings and revenue breakdown
Latest: Q2 2026 · 10-Q filed Aug 13, 2026 · Ondas (ONDS) Q2 2026 earnings results →
Q2 2026 Revenue up 1235% year over year to $83.8M · 107¢ of every $1 of revenue lost · operating margin -194.5%
Ondas made $83.8M in Q2 2026 (13× Y/Y): Product Revenue $43.4M, Service Revenue $23.6M, Development Revenue $16.7M. Operating margin -194.5%, net loss $89.7M. See where every dollar goes — costs, profit and cash — as a Sankey from the 10-Q filed Aug 13, 2026.
Drawing the Sankey…
Open the interactive Sankey → click any line for what the company wrote about it, compare Y/Y and Q/Q, export as PNG or PDF
What changed this quarter
Revenue was $83.8M in Q2 2026, up 1235% year over year and up 67% from the previous quarter. Product Revenue was the largest line at 52% of revenue. Product Revenue added $39.8M year over year (up 1105%), 51% of the total change.
Gross margin was 43.1%, down 10.0 points from Q2 2025. Operating costs exceeded revenue by $162.9M, an operating margin of -194.5%. Operating expenses grew 1482% against revenue growth of 1235%. The fastest-growing cost line was General & admin (+2006%). The quarter ended with a net loss of $89.7M, after a profit of $361.2M the previous quarter. Minority interests bore $1.3M of it: to shareholders the quarter was a loss of $88.4M. Non-operating items added $44.2M, -37% of pre-tax earnings, so the bottom line overstates operating performance.
Operating cash flow was −$86.1M. Non-cash charges added back $934K of depreciation and amortization and $69.1M of share-based compensation. Working capital and other items used $66.4M. Capital expenditures of $7.8M exceeded it, leaving free cash flow of −$93.8M.
Quarterly history
| Quarter | Form | Filed | Revenue | Y/Y | Op. margin | Net earnings | Op. cash flow |
|---|---|---|---|---|---|---|---|
| Q2 2026 | 10-Q | Aug 13, 2026 | $83.8M | 13× | -194.5% | −$89.7M | −$86.1M |
| Q1 2026 | 10-Q | May 15, 2026 | $50.1M | 12× | -85.1% | $361M | −$51.3M |
| Q4 2025 | 10-K | Mar 30, 2026 | $30.1M | +629% | -77.4% | −$99.9M | −$12.7M |
| Q3 2025 | 10-Q | Nov 13, 2025 | $10.1M | +582% | -153.5% | −$7.5M | −$11.0M |
| Q2 2025 | 10-Q | Aug 12, 2025 | $6.3M | +555% | -147.5% | −$10.8M | −$8.4M |
| Q1 2025 | 10-Q | May 15, 2025 | $4.2M | +580% | -242.7% | −$14.1M | −$6.7M |
| Q4 2024 | 10-K | Mar 12, 2025 | $4.1M | -17% | -206.3% | −$10.3M | −$8.1M |
Charts
In supply chains and themes
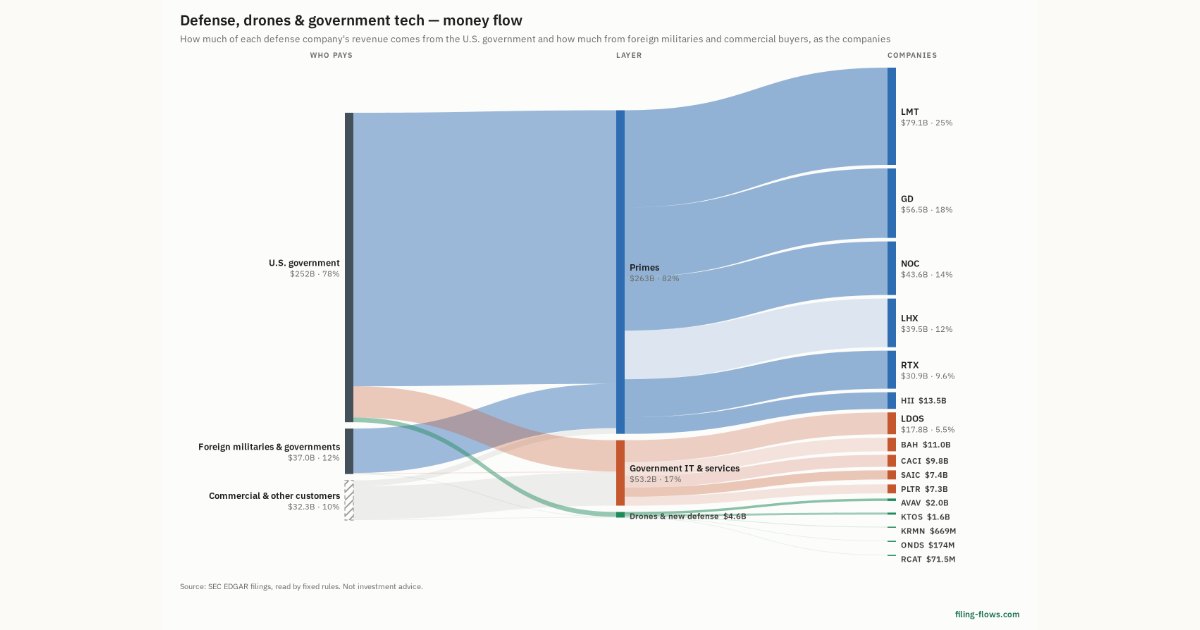
Interactive views
The same charts as the app — open one to draw it.
💵Where each $1 goesinteractive
Loading the interactive chart…
🌏Named in Asian annual reportsinteractive
Loading the interactive chart…
🔄Rotation against the market and its industry (RRG)interactive
Loading the interactive chart…
🔍Earnings qualityinteractive
Loading the interactive chart…
⚖️Fair value by methodinteractive
Loading the interactive chart…
🔭Outlook & guidanceinteractive
Loading the interactive chart…
📈Investments: gains and what it boughtinteractive
Loading the interactive chart…
🏭Its industry’s money flow (input-output)interactive
Loading the interactive chart…
About Ondas
This business description should be read in conjunction with our audited Consolidated Financial Statements and accompanying notes thereto appearing elsewhere in this Annual Report on Form 10-K for the year ended December 31, 2025 (the “Form 10-K”), which are incorporated herein by this reference. The use of the words “we,” “our,” the “Company,” and “Ondas” in this Form 10-K refers to Ondas Inc. and its subsidiaries.
In its own words, from its 10-K, filed Mar 30, 2026.
Ondas against its Radio & Tv Broadcasting & Communications Equipment peers
The largest companies of the same SEC industry, each at its latest quarter. Revenue growth: 13× against the peers' median +12%. Operating margin: -194.5% against the peers' median 7.2%.
| Company | Quarter | Revenue | Y/Y | Op. margin |
|---|---|---|---|---|
| ONDS Ondas | Q2 2026 | $83.8M | 13× | -194.5% |
| QCOM Qualcomm | Q4 FY26 | $10.3B | -8% | 13.1% |
| MSI Motorola Solutions | Q3 2026 | $3.4B | +12% | 23.0% |
| UI Ubiquiti | Q1 FY27 | $1.0B | +40% | 38.1% |
| VISN Vistance Networks | Q3 2026 | $320M | -38% | 7.2% |
| HLIT Harmonic | Q3 2026 | $149M | +64% | 17.6% |
| AVNW Aviat Networks | Q4 FY26 | $121M | +5% | 4.8% |
| PL Planet Labs PBC | Q2 FY27 | $116M | +58% | -11.6% |
| CMTL Comtech Telecommunications | Q3 FY26 | $106M | -16% | -2.9% |
Source: Ondas 10-Q on SEC EDGAR · CIK 1646188 · Radio & Tv Broadcasting & Communications Equipment
13F: who owns ONDS and who is buying
More on ONDS
History
Every quarter: Q2 2026 results · Q1 2026 results · Q4 2025 results · Q3 2025 results · Q2 2025 results · Q1 2025 results · Q4 2024 results