Filing Flows › Utilities › Public Service Enterprise Group (PEG)
Public Service Enterprise Group (PEG) earnings and revenue breakdown
Latest: Q3 2026 · 10-Q filed Nov 2, 2026 · Public Service Enterprise Group (PEG) Q3 2026 earnings results →
Q3 2026 Revenue down 6% year over year to $3.0B · 12¢ of every $1 of revenue kept as net profit · operating margin 20.6%
Public Service Enterprise Group made $3.0B in Q3 2026 (-6% Y/Y). Operating margin 20.6%, net earnings $376M. See where every dollar goes — costs, profit and cash — as a Sankey from the 10-Q filed Nov 2, 2026.
Drawing the Sankey…
Open the interactive Sankey → click any line for what the company wrote about it, compare Y/Y and Q/Q, export as PNG or PDF
What changed this quarter
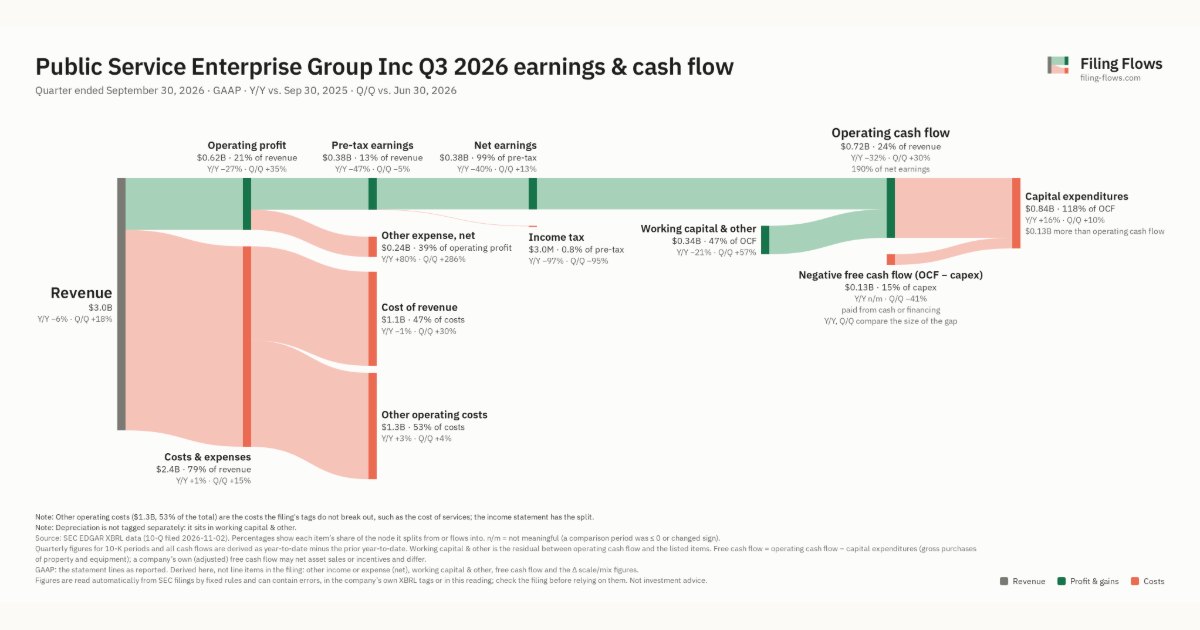
Revenue was $3.0B in Q3 2026, down 6% year over year and up 18% from the previous quarter.
Operating profit was $0.62B, a 20.6% margin (down 5.9 points year over year). Total costs grew 1% against a revenue fall of 6%. Net earnings were $0.38B, down 40% year over year. The effective tax rate was 0.8%.
Operating cash flow was $0.72B (down 32% year over year), 190% of net earnings. Working capital and other items added $0.34B. Capital expenditures of $0.84B exceeded it, leaving free cash flow of −$0.13B.
Quarterly history
| Quarter | Form | Filed | Revenue | Y/Y | Op. margin | Net earnings | Op. cash flow |
|---|---|---|---|---|---|---|---|
| Q3 2026 | 10-Q | Nov 2, 2026 | $3.0B | -6% | 20.6% | $376M | $716M |
| Q2 2026 | 10-Q | Aug 4, 2026 | $2.6B | -9% | 18.1% | $334M | $550M |
| Q1 2026 | 10-Q | May 5, 2026 | $3.8B | +19% | 27.9% | $741M | $1.3B |
| Q4 2025 | 10-K | Feb 26, 2026 | $2.9B | +18% | 17.5% | $315M | $721M |
| Q3 2025 | 10-Q | Nov 3, 2025 | $3.2B | +22% | 26.5% | $622M | $1.1B |
| Q2 2025 | 10-Q | Aug 5, 2025 | $2.8B | +16% | 29.1% | $585M | $478M |
| Q1 2025 | 10-Q | Apr 30, 2025 | $3.2B | +17% | 24.7% | $589M | $1.0B |
Charts
Interactive views
The same charts as the app — open one to draw it.
💵Where each $1 goesinteractive
Loading the interactive chart…
🌏Named in Asian annual reportsinteractive
Loading the interactive chart…
🔄Rotation against the market and its industry (RRG)interactive
Loading the interactive chart…
🔍Earnings qualityinteractive
Loading the interactive chart…
⚖️Fair value by methodinteractive
Loading the interactive chart…
🔭Outlook & guidanceinteractive
Loading the interactive chart…
📈Investments: gains and what it boughtinteractive
Loading the interactive chart…
🏭Its industry’s money flow (input-output)interactive
Loading the interactive chart…
About Public Service Enterprise Group
We were incorporated under the laws of the State of New Jersey in 1985 and our principal executive offices are located at 80 Park Plaza, Newark, New Jersey 07102. We are a public utility holding company that, acting through our wholly owned subsidiaries, is a predominantly regulated electric and gas utility and a nuclear generation business. Our business plan focuses on achieving growth by allocating capital primarily toward regulated investments in an effort to continue to improve the sustainability and predictability of our business and realizing the value of the consistent and reliable carbon-free generation from our nuclear units.
In its own words, from its 10-K, filed Feb 26, 2026.
Public Service Enterprise Group against its Electric & Other Services Combined peers
The largest companies of the same SEC industry, each at its latest quarter. Revenue growth: -6% against the peers' median +7%. Operating margin: 20.6% against the peers' median 22.2%.
| Company | Quarter | Revenue | Y/Y | Op. margin |
|---|---|---|---|---|
| PEG Public Service Enterprise Group | Q3 2026 | $3.0B | -6% | 20.6% |
| DUK Duke Energy | Q3 2026 | $9.1B | +7% | 30.2% |
| Pepco Holdings LLC | Q3 2026 | $7.3B | +9% | 18.8% |
| EXC Exelon | Q1 2026 | $7.2B | +8% | 22.2% |
| PCG PG&E | Q3 2026 | $6.2B | -1% | 20.2% |
| ED Consolidated Edison | Q3 2026 | $4.9B | +8% | 23.8% |
| XEL Xcel Energy | Q3 2026 | $4.2B | +7% | 28.5% |
| Consolidated Edison Co of New York | Q2 2026 | $4.1B | +13% | 13.6% |
| AEE Ameren | Q3 2026 | $2.9B | +7% | 31.2% |
Source: Public Service Enterprise Group 10-Q on SEC EDGAR · CIK 788784 · Electric & Other Services Combined
Guidance and outlook
13F: who owns PEG and who is buying
More on PEG
- How Public Service Enterprise Group makes money: revenue by segment
- Public Service Enterprise Group next earnings date and what analysts expect
- Public Service Enterprise Group stock forecast, price target and fair value
- Who owns Public Service Enterprise Group stock: holders, funds and Congress trades
- Public Service Enterprise Group guidance and outlook
- Public Service Enterprise Group recalls, complaints and regulation
History
Every quarter: Q3 2026 results · Q2 2026 results · Q1 2026 results · Q4 2025 results · Q3 2025 results · Q2 2025 results · Q1 2025 results