Filing Flows › Industrials › Polaris (PII)
Polaris (PII) earnings and revenue breakdown
Latest: Q3 2026 · 10-Q filed Oct 27, 2026 · Polaris (PII) Q3 2026 earnings results →
Q3 2026 Revenue up 11% year over year to $2.0B · 2¢ of every $1 of revenue kept as net profit · operating margin 3.6%
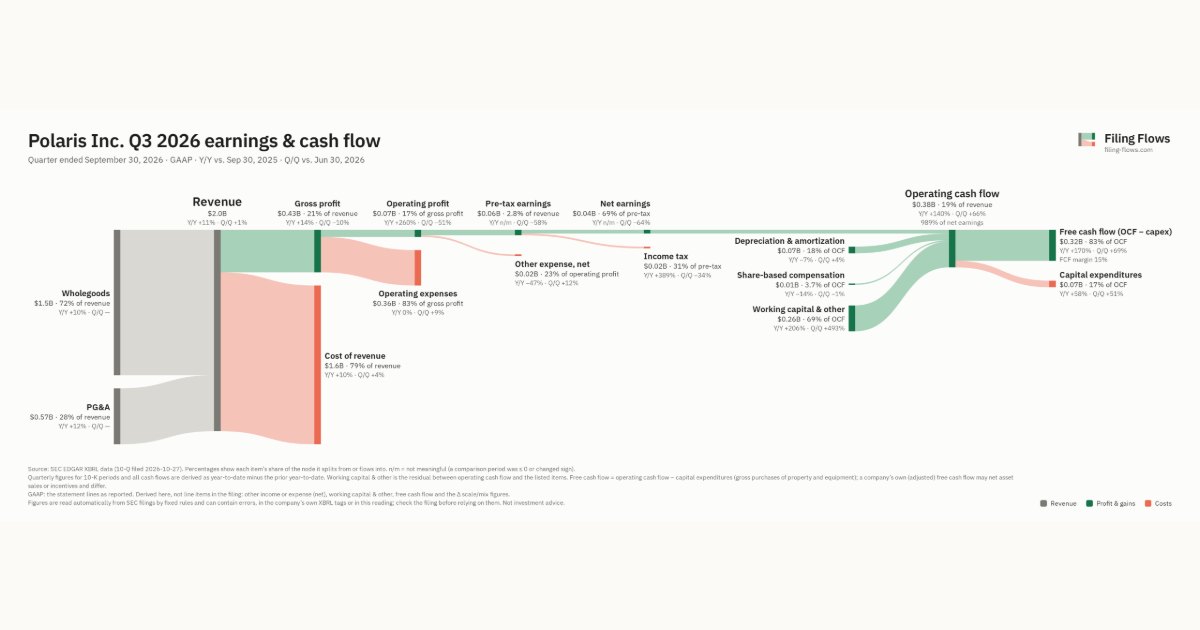
Polaris made $2.0B in Q3 2026 (+11% Y/Y): Wholegoods $1.5B, PG&A $568M. Operating margin 3.6%, net earnings $38.6M. See where every dollar goes — costs, profit and cash — as a Sankey from the 10-Q filed Oct 27, 2026.
Drawing the Sankey…
Open the interactive Sankey → click any line for what the company wrote about it, compare Y/Y and Q/Q, export as PNG or PDF
What changed this quarter
Revenue was $2.0B in Q3 2026, up 11% year over year and up 1% from the previous quarter. Wholegoods was the largest line at 72% of revenue. Wholegoods added $0.14B year over year (up 10%), 69% of the total change.
Gross margin was 21.2%, up 0.5 points from Q3 2025. Operating profit was $0.07B, a 3.6% margin (up 2.5 points year over year). Of the extra revenue versus Q3 2025, 26% reached operating profit, above the 1% margin then. Operating expenses fell 0% while revenue rose 11%. Net earnings were $0.04B. The effective tax rate was 31.3%.
Operating cash flow was $0.38B (up 140% year over year), 989% of net earnings. Non-cash charges added back $0.07B of depreciation and amortization and $0.01B of share-based compensation. Working capital and other items added $0.26B. Capital expenditures of $0.07B left free cash flow of $0.32B.
Quarterly history
| Quarter | Form | Filed | Revenue | Y/Y | Op. margin | Net earnings | Op. cash flow |
|---|---|---|---|---|---|---|---|
| Q3 2026 | 10-Q | Oct 27, 2026 | $2.0B | +11% | 3.6% | $38.6M | $382M |
| Q2 2026 | 10-Q | Jul 28, 2026 | $2.0B | +9% | 7.4% | $107M | $230M |
| Q1 2026 | 10-Q | Apr 28, 2026 | $1.7B | +8% | -2.4% | −$47.2M | −$320M |
| Q4 2025 | 10-K | Feb 13, 2026 | $1.9B | +10% | -16.7% | −$303M | $179M |
| Q3 2025 | 10-Q | Oct 28, 2025 | $1.8B | +7% | 1.1% | −$15.7M | $159M |
| Q2 2025 | 10-Q | Jul 29, 2025 | $1.9B | -6% | -0.7% | −$79.1M | $320M |
| Q1 2025 | 10-Q | Apr 30, 2025 | $1.5B | -12% | -2.4% | −$66.7M | $83.2M |
Charts
Interactive views
The same charts as the app — open one to draw it.
💵Where each $1 goesinteractive
Loading the interactive chart…
🌏Named in Asian annual reportsinteractive
Loading the interactive chart…
🔄Rotation against the market and its industry (RRG)interactive
Loading the interactive chart…
🔍Earnings qualityinteractive
Loading the interactive chart…
⚖️Fair value by methodinteractive
Loading the interactive chart…
🔭Outlook & guidanceinteractive
Loading the interactive chart…
📈Investments: gains and what it boughtinteractive
Loading the interactive chart…
🏭Its industry’s money flow (input-output)interactive
Loading the interactive chart…
About Polaris
Polaris Inc., formerly known as Polaris Industries Inc., a Delaware corporation, was formed in 1994 and is the successor to Polaris Industries Partners LP. The terms “Polaris,” the “Company,” “we,” “us,” and “our” as used herein refer to the business and operations of Polaris Inc., its subsidiaries and its predecessors, which began doing business in 1954. We design, engineer, manufacture and market powersports vehicles which include: off-road vehicles (“ORV”), including all-terrain vehicles (“ATV”) and side-by-side vehicles; military and commercial ORVs; snowmobiles; moto-roadsters; quadricycles; and boats. We also design and manufacture or source parts, garments and accessories (“PG&A”), which includes aftermarket accessories and apparel.
In its own words, from its 10-K, filed Feb 13, 2026.
Polaris against its Miscellaneous Transportation Equipment peers
The largest companies of the same SEC industry, each at its latest quarter.
| Company | Quarter | Revenue | Y/Y | Op. margin |
|---|---|---|---|---|
| PII Polaris | Q3 2026 | $2.0B | +11% | 3.6% |
| MAMO Massimo | Q2 2026 | $14.9M | -21% | 11.1% |
Source: Polaris 10-Q on SEC EDGAR · CIK 931015 · Miscellaneous Transportation Equipment
13F: who owns PII and who is buying
More on PII
History
Every quarter: Q3 2026 results · Q2 2026 results · Q1 2026 results · Q4 2025 results · Q3 2025 results · Q2 2025 results · Q1 2025 results