Filing Flows › Industrials › Pool (POOL)
Pool (POOL) earnings and revenue breakdown
Latest: Q3 2026 · 10-Q filed Oct 28, 2026 · Pool (POOL) Q3 2026 earnings results →
Q3 2026 Revenue up 4% year over year to $1.5B · 8¢ of every $1 of revenue kept as net profit · operating margin 11.4%
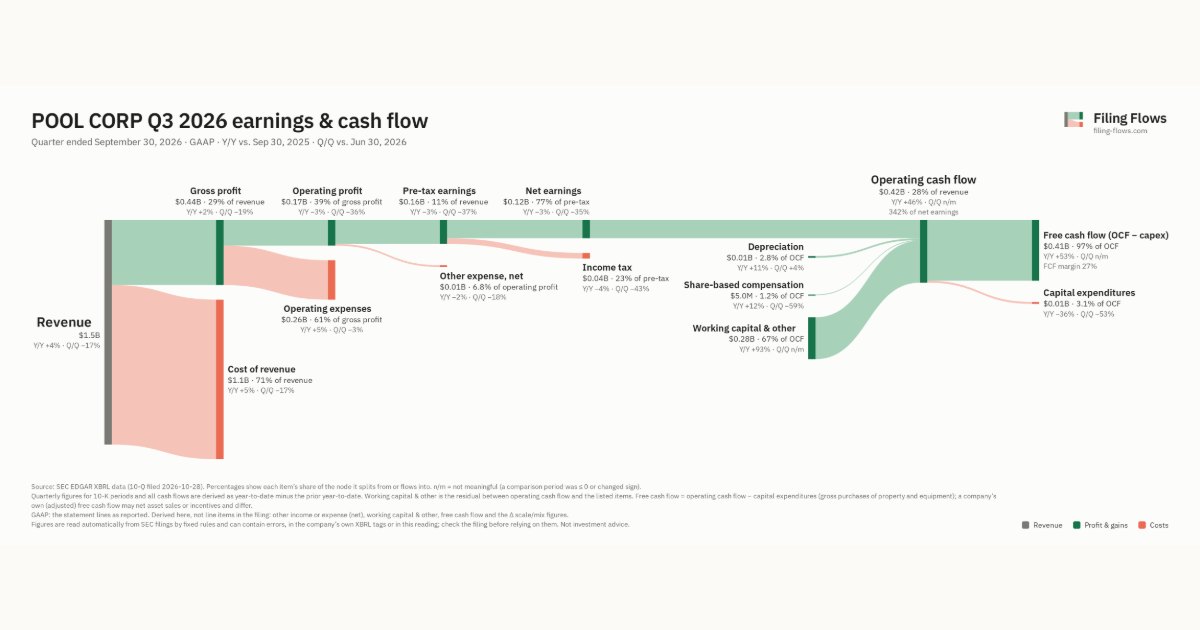
Pool made $1.5B in Q3 2026 (+4% Y/Y). Operating margin 11.4%, net earnings $123M. See where every dollar goes — costs, profit and cash — as a Sankey from the 10-Q filed Oct 28, 2026.
Drawing the Sankey…
Open the interactive Sankey → click any line for what the company wrote about it, compare Y/Y and Q/Q, export as PNG or PDF
What changed this quarter
Revenue was $1.5B in Q3 2026, up 4% year over year and down 17% from the previous quarter.
Gross margin was 29.0%, down 0.6 points from Q3 2025. Operating profit was $0.17B, a 11.4% margin (down 0.8 points year over year). Operating profit fell $0.01B even though revenue rose $0.05B versus Q3 2025, so costs grew faster than sales. Operating expenses grew 5% against revenue growth of 4%. Net earnings were $0.12B, down 3% year over year. The effective tax rate was 23.3%.
Operating cash flow was $0.42B (up 46% year over year), 342% of net earnings. Non-cash charges added back $0.01B of depreciation and $5.0M of share-based compensation. Working capital and other items added $0.28B. Capital expenditures of $0.01B left free cash flow of $0.41B.
Quarterly history
| Quarter | Form | Filed | Revenue | Y/Y | Op. margin | Net earnings | Op. cash flow |
|---|---|---|---|---|---|---|---|
| Q3 2026 | 10-Q | Oct 28, 2026 | $1.5B | +4% | 11.4% | $123M | $421M |
| Q2 2026 | 10-Q | Jul 29, 2026 | $1.8B | +2% | 14.7% | $188M | −$26.5M |
| Q1 2026 | 10-Q | Apr 28, 2026 | $1.1B | +6% | 7.3% | $53.2M | $25.7M |
| Q4 2025 | 10-K | Feb 26, 2026 | $982M | -0.5% | 5.3% | $31.6M | $80.1M |
| Q3 2025 | 10-Q | Oct 29, 2025 | $1.5B | +1% | 12.3% | $127M | $287M |
| Q2 2025 | 10-Q | Jul 30, 2025 | $1.8B | +0.8% | 15.3% | $194M | −$28.8M |
| Q1 2025 | 10-Q | Apr 29, 2025 | $1.1B | -4% | 7.2% | $53.5M | $27.2M |
Charts
Interactive views
The same charts as the app — open one to draw it.
💵Where each $1 goesinteractive
Loading the interactive chart…
🌏Named in Asian annual reportsinteractive
Loading the interactive chart…
🔄Rotation against the market and its industry (RRG)interactive
Loading the interactive chart…
🔍Earnings qualityinteractive
Loading the interactive chart…
⚖️Fair value by methodinteractive
Loading the interactive chart…
🔭Outlook & guidanceinteractive
Loading the interactive chart…
📈Investments: gains and what it boughtinteractive
Loading the interactive chart…
🏭Its industry’s money flow (input-output)interactive
Loading the interactive chart…
Customers and suppliers named in filings
Sells to
Buys from
About Pool
Pool Corporation (the Company , which may also be referred to as we, us or our ), a member of the S&P 500 Index, is the world’s largest wholesale distributor of swimming pool supplies, equipment and related leisure products and is one of the leading distributors of irrigation and landscape maintenance products in the United States. As of December 31, 2025, we operated 456 sales centers strategically located in North America, Europe and Australia, from which we sell swimming pool supplies, equipment and related leisure products, irrigation and landscape maintenance products and hardscapes, tile and stone products. Our customer base generally includes pool builders, pool service companies, retail stores, commercial pool operators and landscape contractors. We distribute products through our five distribution networks listed below:
In its own words, from its 10-K, filed Feb 26, 2026.
Pool against its Wholesale-Misc Durable Goods peers
The largest companies of the same SEC industry, each at its latest quarter. Revenue growth: +4% against the peers' median -27%. Operating margin: 11.4% against the peers' median -5.5%.
| Company | Quarter | Revenue | Y/Y | Op. margin |
|---|---|---|---|---|
| POOL Pool | Q3 2026 | $1.5B | +4% | 11.4% |
| Kingfish Holding | Q3 FY26 | $757K | -27% | -5.5% |
| SGLA Sino Green Land | Q4 FY26 | $361K | -36% | -159.8% |
Source: Pool 10-Q on SEC EDGAR · CIK 945841 · Wholesale-Misc Durable Goods
Guidance and outlook
13F: who owns POOL and who is buying
More on POOL
History
Every quarter: Q3 2026 results · Q2 2026 results · Q1 2026 results · Q4 2025 results · Q3 2025 results · Q2 2025 results · Q1 2025 results