Filing Flows › Technology › D-Wave Quantum (QBTS)
D-Wave Quantum (QBTS) earnings and revenue breakdown
Latest: Q2 2026 · 10-Q filed Aug 6, 2026 · D-Wave Quantum (QBTS) Q2 2026 earnings results →
Q2 2026 Revenue down 1% year over year to $3.1M
D-Wave Quantum made $3.1M in Q2 2026 (-0.6% Y/Y): QCaaS $1.9M, Professional services $929K, System sales $255K. Operating margin n/m, net loss $48.0M. See where every dollar goes — costs, profit and cash — as a Sankey from the 10-Q filed Aug 6, 2026.
Drawing the Sankey…
Open the interactive Sankey → click any line for what the company wrote about it, compare Y/Y and Q/Q, export as PNG or PDF
What changed this quarter
Revenue was $3.1M in Q2 2026, down 1% year over year and up 8% from the previous quarter. QCaaS was the largest line at 60% of revenue. System sales lost $770K year over year (down 75%), 4053% of the total change.
Gross margin was 55.4%, down 8.4 points from Q2 2025. Operating costs exceeded revenue by $53.3M, an operating margin of -1732.1%. Operating expenses grew 93% against a revenue fall of 1%. The fastest-growing cost line was Research & development (+122%). The quarter ended with a net loss of $48.0M, wider than the previous quarter's $18.4M loss.
Operating cash flow was −$28.5M. Non-cash charges added back $4.7M of depreciation and amortization and $11.1M of share-based compensation. Working capital and other items added $3.7M. Capital expenditures of $4.4M exceeded it, leaving free cash flow of −$32.9M.
Quarterly history
| Quarter | Form | Filed | Revenue | Y/Y | Op. margin | Net earnings | Op. cash flow |
|---|---|---|---|---|---|---|---|
| Q2 2026 | 10-Q | Aug 6, 2026 | $3.1M | -0.6% | n/m | −$48.0M | −$28.5M |
| Q1 2026 | 10-Q | May 12, 2026 | $2.9M | -81% | n/m | −$18.4M | −$45.0M |
| Q4 2025 | 10-K | Feb 26, 2026 | $2.8M | +19% | n/m | −$42.3M | −$18.4M |
| Q3 2025 | 10-Q | Nov 6, 2025 | $3.7M | +100% | -741.8% | −$140M | −$19.0M |
| Q2 2025 | 10-Q | Aug 7, 2025 | $3.1M | +42% | -856.3% | −$167M | −$15.3M |
| Q1 2025 | 10-Q | May 8, 2025 | $15.0M | +509% | -75.3% | −$5.4M | −$19.3M |
| Q4 2024 | 10-K | Mar 14, 2025 | $2.3M | -20% | -876.2% | −$86.1M | $2.0M |
Charts
In supply chains and themes
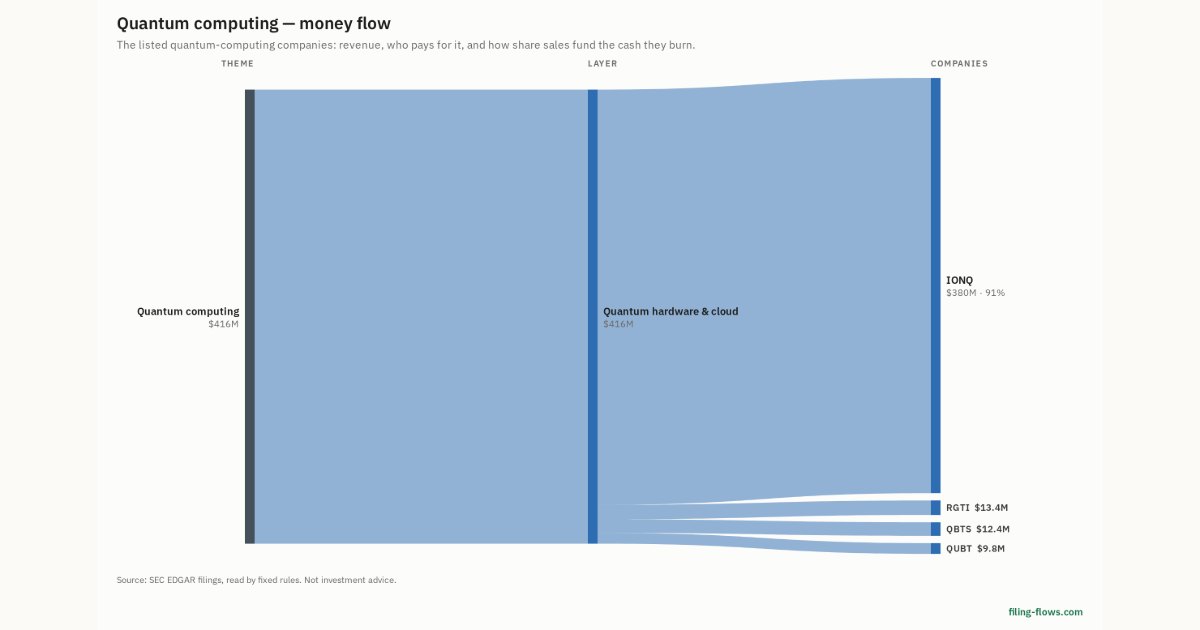
Interactive views
The same charts as the app — open one to draw it.
💵Where each $1 goesinteractive
Loading the interactive chart…
🌏Named in Asian annual reportsinteractive
Loading the interactive chart…
🔄Rotation against the market and its industry (RRG)interactive
Loading the interactive chart…
🔍Earnings qualityinteractive
Loading the interactive chart…
⚖️Fair value by methodinteractive
Loading the interactive chart…
🔭Outlook & guidanceinteractive
Loading the interactive chart…
📈Investments: gains and what it boughtinteractive
Loading the interactive chart…
🏭Its industry’s money flow (input-output)interactive
Loading the interactive chart…
About D-Wave Quantum
Unless the context requires otherwise, references in this section to “D-Wave,” “we,” “our” or “us” refer to D-Wave Quantum Inc., a Delaware corporation, and its consolidated subsidiaries following the consummation of the Transaction, and prior to the consummation of the Transaction, to D-Wave Systems Inc., a British Columbia corporation ("D-Wave Systems"). At D-Wave, our mission is to help customers realize the value of quantum computing to address complex computational problems that cannot be solved with classical computing alone. As a pioneer in the quantum industry for more than 25 years, D-Wave is the world’s first company to deliver commercial-grade annealing quantum computing systems and solutions.
In its own words, from its 10-K, filed Feb 26, 2026.
D-Wave Quantum against its Services-Computer Processing & Data Preparation peers
The largest companies of the same SEC industry, each at its latest quarter. Revenue growth: -0.6% against the peers' median +6%.
| Company | Quarter | Revenue | Y/Y | Op. margin |
|---|---|---|---|---|
| QBTS D-Wave Quantum | Q2 2026 | $3.1M | -0.6% | n/m |
| ADP Automatic Data Processing | Q1 FY27 | $5.5B | +6% | 23.9% |
| DXC DXC Technology | Q2 FY27 | $3.0B | -4% | 6.2% |
| WDAY Workday | Q2 FY27 | $2.6B | +13% | 11.8% |
| TOST Toast | Q3 2026 | $2.0B | +21% | 8.3% |
| RDDT Reddit | Q3 2026 | $895M | +53% | 29.2% |
| VRSK Verisk Analytics | Q3 2026 | $809M | +5% | 45.2% |
| RNG RingCentral | Q3 2026 | $676M | +6% | 8.0% |
| PLTK Playtika Holding | Q3 2026 | $674M | -0.1% | 17.2% |
Source: D-Wave Quantum 10-Q on SEC EDGAR · CIK 1907982 · Services-Computer Processing & Data Preparation
13F: who owns QBTS and who is buying
More on QBTS
History
Every quarter: Q2 2026 results · Q1 2026 results · Q4 2025 results · Q3 2025 results · Q2 2025 results · Q1 2025 results · Q4 2024 results