Filing Flows › Technology › Workday (WDAY)
Workday (WDAY) earnings and revenue breakdown
Latest: Q2 FY27 · 10-Q filed Aug 27, 2026 · Workday (WDAY) Q2 FY27 earnings results →
Q2 FY27 Revenue up 13% year over year to $2.6B · 24¢ of every $1 of revenue kept as net profit · operating margin 11.8%
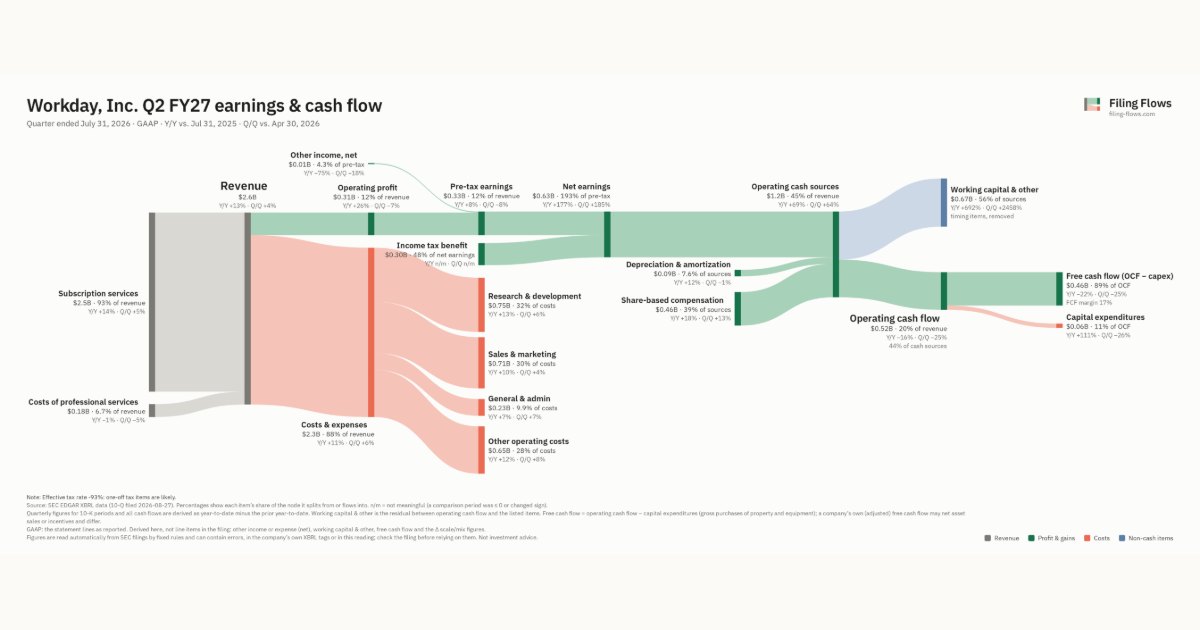
Workday made $2.6B in Q2 FY27 (+13% Y/Y): Subscription services $2.5B, Professional Services $178M. Operating margin 11.8%, net earnings $632M. See where every dollar goes — costs, profit and cash — as a Sankey from the 10-Q filed Aug 27, 2026.
Drawing the Sankey…
Open the interactive Sankey → click any line for what the company wrote about it, compare Y/Y and Q/Q, export as PNG or PDF
What changed this quarter
Revenue was $2.6B in Q2 FY27, up 13% year over year and up 4% from the previous quarter. Subscription services was the largest line at 93% of revenue. Subscription services added $0.30B year over year (up 14%), 100% of the total change. Professional Services declined 1%.
Operating profit was $0.31B, a 11.8% margin (up 1.3 points year over year). Of the extra revenue versus Q2 FY26, 22% reached operating profit, above the 11% margin then. Total costs grew 11% against revenue growth of 13%. The fastest-growing cost line was Research & development (+13%). Net earnings were $0.63B, up 177% year over year. The effective tax rate was -93.3%.
Operating cash flow was $0.52B (down 16% year over year), 82% of net earnings. Non-cash charges added back $0.09B of depreciation and amortization and $0.46B of share-based compensation. Working capital and other items used $0.67B. Capital expenditures of $0.06B left free cash flow of $0.46B.
Quarterly history
| Quarter | Form | Filed | Revenue | Y/Y | Op. margin | Net earnings | Op. cash flow |
|---|---|---|---|---|---|---|---|
| Q2 FY27 | 10-Q | Aug 27, 2026 | $2.6B | +13% | 11.8% | $632M | $519M |
| Q1 FY27 | 10-Q | May 22, 2026 | $2.5B | +14% | 13.3% | $222M | $696M |
| Q4 FY26 | 10-K | Mar 6, 2026 | $2.5B | +14% | 6.9% | $145M | $1.3B |
| Q3 FY26 | 10-Q | Nov 26, 2025 | $2.4B | +13% | 10.6% | $252M | $588M |
| Q2 FY26 | 10-Q | Aug 22, 2025 | $2.3B | +13% | 10.6% | $228M | $616M |
| Q1 FY26 | 10-Q | May 23, 2025 | $2.2B | +13% | 1.7% | $68.0M | $457M |
| Q4 FY25 | 10-K | Mar 11, 2025 | $2.2B | +15% | 3.4% | $94.0M | $1.1B |
Charts
Interactive views
The same charts as the app — open one to draw it.
💵Where each $1 goesinteractive
Loading the interactive chart…
🌏Named in Asian annual reportsinteractive
Loading the interactive chart…
🔄Rotation against the market and its industry (RRG)interactive
Loading the interactive chart…
🔍Earnings qualityinteractive
Loading the interactive chart…
⚖️Fair value by methodinteractive
Loading the interactive chart…
🔭Outlook & guidanceinteractive
Loading the interactive chart…
📈Investments: gains and what it boughtinteractive
Loading the interactive chart…
🏭Its industry’s money flow (input-output)interactive
Loading the interactive chart…
About Workday
Workday is the enterprise AI platform for managing people, money, and agents. Workday provides more than 11,500 organizations with cloud solutions powered by artificial intelligence (“AI”) to help solve some of today’s most complex business challenges, including supporting and empowering their workforce, managing their finances and spend in an ever-changing environment, and planning for the unexpected. We strive to reimagine how work gets done and hope to empower customers to do the same through an innovative suite of solutions with more than 75 million users under contract around the world and across industries – from emerging and medium-sized businesses to more than 65% of the Fortune 500. Central to our purpose is a set of core values – with our employees as number one – along with customer service, innovation, integrity, fun, and profitability.
In its own words, from its 10-K, filed Mar 6, 2026.
Workday against its Services-Computer Processing & Data Preparation peers
The largest companies of the same SEC industry, each at its latest quarter. Revenue growth: +13% against the peers' median +6%. Operating margin: 11.8% against the peers' median 11.8%.
| Company | Quarter | Revenue | Y/Y | Op. margin |
|---|---|---|---|---|
| WDAY Workday | Q2 FY27 | $2.6B | +13% | 11.8% |
| ADP Automatic Data Processing | Q1 FY27 | $5.5B | +6% | 23.9% |
| DXC DXC Technology | Q2 FY27 | $3.0B | -4% | 6.2% |
| TOST Toast | Q3 2026 | $2.0B | +21% | 8.3% |
| RDDT Reddit | Q3 2026 | $895M | +53% | 29.2% |
| VRSK Verisk Analytics | Q3 2026 | $809M | +5% | 45.2% |
| RNG RingCentral | Q3 2026 | $676M | +6% | 8.0% |
| PLTK Playtika Holding | Q3 2026 | $674M | -0.1% | 17.2% |
| CLVT Clarivate | Q3 2026 | $482M | -9% | 8.3% |
Source: Workday 10-Q on SEC EDGAR · CIK 1327811 · Services-Computer Processing & Data Preparation
13F: who owns WDAY and who is buying
More on WDAY
History
Every quarter: Q2 FY27 results · Q1 FY27 results · Q4 FY26 results · Q3 FY26 results · Q2 FY26 results · Q1 FY26 results · Q4 FY25 results