Filing Flows › Industrials › Redwire (RDW)
Redwire (RDW) earnings and revenue breakdown
Latest: Q3 2026 · 10-Q filed Nov 5, 2026 · Redwire (RDW) Q3 2026 earnings results →
Q3 2026 Revenue up 5% year over year to $109M · 21¢ of every $1 of revenue lost · operating margin -24.1%
Redwire made $109M in Q3 2026 (+5% Y/Y): Space $61.3M, Defense Tech $47.8M. Operating margin -24.1%, net loss $23.2M. See where every dollar goes — costs, profit and cash — as a Sankey from the 10-Q filed Nov 5, 2026.
Drawing the Sankey…
Open the interactive Sankey → click any line for what the company wrote about it, compare Y/Y and Q/Q, export as PNG or PDF
What changed this quarter
Revenue was $109.0M in Q3 2026, up 5% year over year and down 7% from the previous quarter. Space was the largest line at 56% of revenue. Space added $14.7M year over year (up 32%), 263% of the total change. Defense Tech declined 16%.
Gross margin was 32.3%, up 16.1 points from Q3 2025. Operating costs exceeded revenue by $26.3M, an operating margin of -24.1%. Operating expenses grew 5% against revenue growth of 5%. The fastest-growing cost line was Research & development (+87%). The quarter ended with a net loss of $23.2M, narrower than the previous quarter's $41.0M loss.
Operating cash flow was −$63.6M. Non-cash charges added back $11.2M of depreciation and amortization and $6.3M of share-based compensation. Working capital and other items used $57.9M. Capital expenditures of $1.8M exceeded it, leaving free cash flow of −$65.3M.
Quarterly history
| Quarter | Form | Filed | Revenue | Y/Y | Op. margin | Net earnings | Op. cash flow |
|---|---|---|---|---|---|---|---|
| Q3 2026 | 10-Q | Nov 5, 2026 | $109M | +5% | -24.1% | −$23.2M | −$63.6M |
| Q2 2026 | 10-Q | Aug 6, 2026 | $117M | +90% | -18.9% | −$41.0M | −$24.9M |
| Q1 2026 | 10-Q | May 7, 2026 | $97.0M | +58% | -71.9% | −$76.5M | −$6.7M |
| Q4 2025 | 10-K | Feb 27, 2026 | $109M | +56% | -75.0% | −$85.5M | −$24.3M |
| Q3 2025 | 10-Q | Nov 6, 2025 | $103M | +51% | -40.5% | −$41.2M | −$20.3M |
| Q2 2025 | 10-Q | Aug 7, 2025 | $61.8M | -21% | -148.8% | −$97.0M | −$87.7M |
| Q1 2025 | 10-Q | May 12, 2025 | $61.4M | -30% | -23.3% | −$2.9M | −$45.1M |
Charts
In supply chains and themes
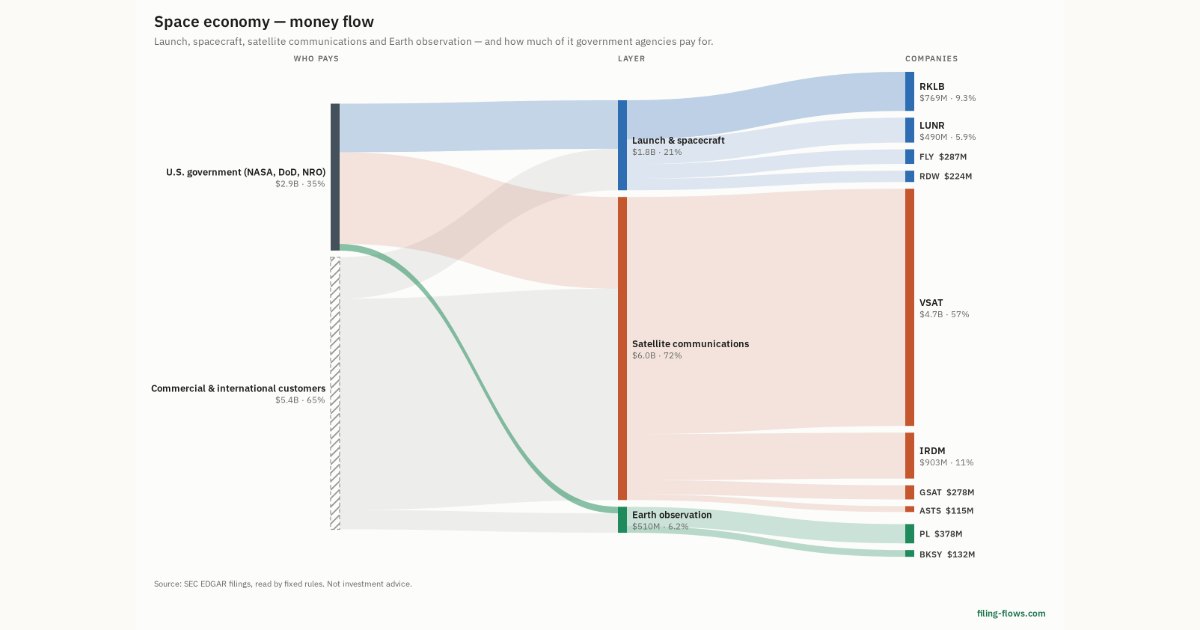
Interactive views
The same charts as the app — open one to draw it.
💵Where each $1 goesinteractive
Loading the interactive chart…
🌏Named in Asian annual reportsinteractive
Loading the interactive chart…
🔄Rotation against the market and its industry (RRG)interactive
Loading the interactive chart…
🔍Earnings qualityinteractive
Loading the interactive chart…
⚖️Fair value by methodinteractive
Loading the interactive chart…
🔭Outlook & guidanceinteractive
Loading the interactive chart…
📈Investments: gains and what it boughtinteractive
Loading the interactive chart…
🏭Its industry’s money flow (input-output)interactive
Loading the interactive chart…
About Redwire
Redwire is an integrated space and defense technology company focused on advanced technologies. The Company’s vision is to pioneer next-generation space and defense technologies that empower scientific discovery, advance global industries, and strengthen security - transforming how humanity explores, connects, and protects - from the skies above to the stars beyond. Powered by this vision, Redwire is building the future of aerospace infrastructure, autonomous systems, and multi-domain operations, leveraging digital engineering and artificial intelligence (“AI”) automation.
In its own words, from its 10-K, filed Feb 27, 2026.
Redwire against its Guided Missiles & Space Vehicles & Parts peers
The largest companies of the same SEC industry, each at its latest quarter. Revenue growth: +5% against the peers' median +11%. Operating margin: -24.1% against the peers' median -44.6%.
| Company | Quarter | Revenue | Y/Y | Op. margin |
|---|---|---|---|---|
| RDW Redwire | Q3 2026 | $109M | +5% | -24.1% |
| LMT Lockheed Martin | Q3 2026 | $20.7B | +11% | 11.8% |
| KTOS Kratos Defense & Security Solutions | Q3 2026 | $472M | +36% | -1.0% |
| RKLB Rocket Lab | Q2 2026 | $234M | +62% | -24.6% |
| FLY Firefly Aerospace | Q2 2026 | $118M | +657% | -80.9% |
| YSS York Space Systems | Q2 2026 | $92.5M | +10% | -44.6% |
| VOYG Voyager Technologies | Q3 2026 | $88.7M | +124% | -69.8% |
| HLEO Helio | Q3 FY26 | $591K | -25% | -92.5% |
| MNTS Momentus | Q2 2026 | $25K | -87% | n/m |
Source: Redwire 10-Q on SEC EDGAR · CIK 1819810 · Guided Missiles & Space Vehicles & Parts
Guidance and outlook
13F: who owns RDW and who is buying
More on RDW
History
Every quarter: Q3 2026 results · Q2 2026 results · Q1 2026 results · Q4 2025 results · Q3 2025 results · Q2 2025 results · Q1 2025 results