Filing Flows › Industrials › Rocket Lab (RKLB)
Rocket Lab (RKLB) earnings and revenue breakdown
Latest: Q2 2026 · 10-Q filed Aug 10, 2026 · Rocket Lab (RKLB) Q2 2026 earnings results →
Q2 2026 Revenue up 62% year over year to $234M · 21¢ of every $1 of revenue lost · operating margin -24.6%
Rocket Lab made $234M in Q2 2026 (+62% Y/Y): Product revenues $181M, Service revenues $52.7M. Operating margin -24.6%, net loss $49.3M. See where every dollar goes — costs, profit and cash — as a Sankey from the 10-Q filed Aug 10, 2026.
Drawing the Sankey…
Open the interactive Sankey → click any line for what the company wrote about it, compare Y/Y and Q/Q, export as PNG or PDF
What changed this quarter
Revenue was $234.1M in Q2 2026, up 62% year over year and up 17% from the previous quarter. Product revenues was the largest line at 77% of revenue. Product revenues added $88.6M year over year (up 96%), 99% of the total change.
Gross margin was 36.1%, up 4.0 points from Q2 2025. Operating costs exceeded revenue by $57.5M, an operating margin of -24.6%. Operating expenses grew 34% against revenue growth of 62%. The fastest-growing cost line was SG&A (+50%). The quarter ended with a net loss of $49.3M, wider than the previous quarter's $45.0M loss. Non-operating items added $13.6M, -31% of pre-tax earnings, so the bottom line overstates operating performance.
Operating cash flow was −$84.1M. Non-cash charges added back $20.9M of depreciation and amortization and $19.6M of share-based compensation. Working capital and other items used $75.3M. Capital expenditures of $26.0M exceeded it, leaving free cash flow of −$110.1M.
Quarterly history
| Quarter | Form | Filed | Revenue | Y/Y | Op. margin | Net earnings | Op. cash flow |
|---|---|---|---|---|---|---|---|
| Q2 2026 | 10-Q | Aug 10, 2026 | $234M | +62% | -24.6% | −$49.3M | −$84.1M |
| Q1 2026 | 10-Q | May 7, 2026 | $200M | +64% | -27.9% | −$45.0M | −$50.3M |
| Q4 2025 | 10-K | Feb 26, 2026 | $180M | +36% | -28.4% | −$52.9M | −$64.5M |
| Q3 2025 | 10-Q | Nov 10, 2025 | $155M | +48% | -38.0% | −$18.3M | −$23.5M |
| Q2 2025 | 10-Q | Aug 7, 2025 | $144M | +36% | -41.3% | −$66.4M | −$23.2M |
| Q1 2025 | 10-Q | May 8, 2025 | $123M | +32% | -48.3% | −$60.6M | −$54.2M |
| Q4 2024 | 10-K | Feb 27, 2025 | $132M | +121% | -38.9% | −$52.3M | −$2.4M |
Charts
In supply chains and themes
Interactive views
The same charts as the app — open one to draw it.
💵Where each $1 goesinteractive
Loading the interactive chart…
🌏Named in Asian annual reportsinteractive
Loading the interactive chart…
🔄Rotation against the market and its industry (RRG)interactive
Loading the interactive chart…
🔍Earnings qualityinteractive
Loading the interactive chart…
⚖️Fair value by methodinteractive
Loading the interactive chart…
🔭Outlook & guidanceinteractive
Loading the interactive chart…
📈Investments: gains and what it boughtinteractive
Loading the interactive chart…
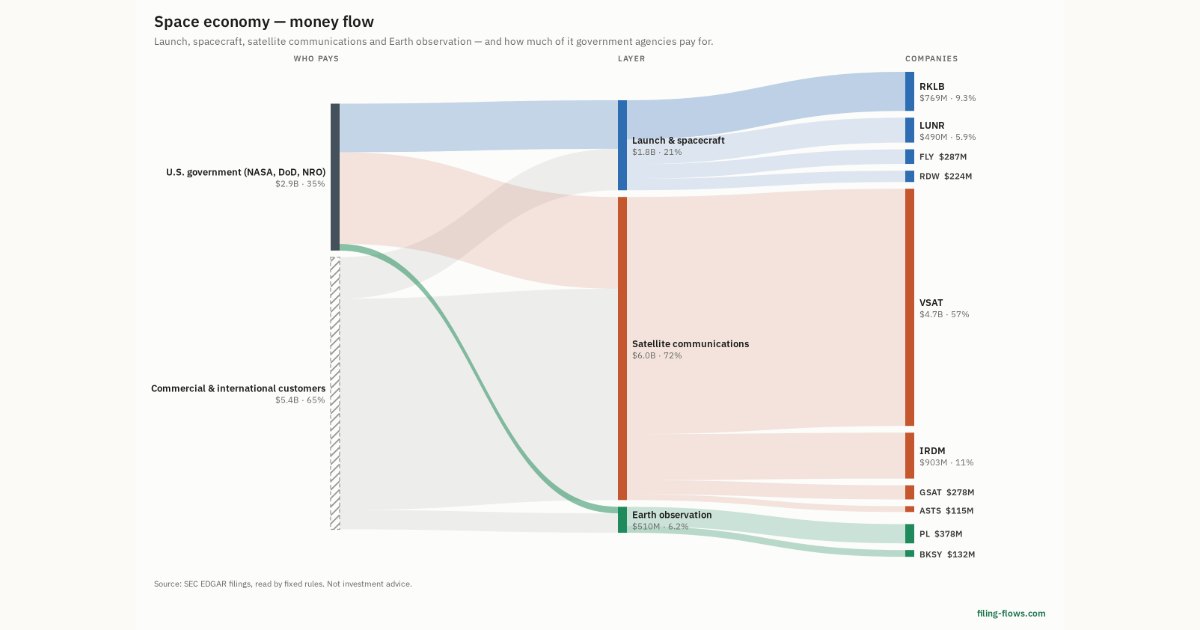
🏭Its industry’s money flow (input-output)interactive
Loading the interactive chart…
Customers and suppliers named in filings
Sells to
- U.S. government — 47% of its revenue · Stated in 10-K (sentence) · source
- LMT — 16% of its revenue · Stated in 10-K (customer table) · source
- usgov · named in a filing
About Rocket Lab
Rocket Lab is an end-to-end space company with an established track record of mission success. We deliver reliable launch services, spacecraft design services, spacecraft components, spacecraft manufacturing, optical systems and other spacecraft and on-orbit management solutions that make it faster, easier and more affordable to access space. We believe that space has defined some of humanity’s greatest achievements and it continues to shape our future. We are motivated by the impact we can have on Earth by making it easier to get to space and using it as a platform for innovation, exploration and infrastructure.
In its own words, from its 10-K, filed Feb 26, 2026.
Rocket Lab against its Guided Missiles & Space Vehicles & Parts peers
The largest companies of the same SEC industry, each at its latest quarter. Revenue growth: +62% against the peers' median +11%. Operating margin: -24.6% against the peers' median -44.6%.
| Company | Quarter | Revenue | Y/Y | Op. margin |
|---|---|---|---|---|
| RKLB Rocket Lab | Q2 2026 | $234M | +62% | -24.6% |
| LMT Lockheed Martin | Q3 2026 | $20.7B | +11% | 11.8% |
| KTOS Kratos Defense & Security Solutions | Q3 2026 | $472M | +36% | -1.0% |
| FLY Firefly Aerospace | Q2 2026 | $118M | +657% | -80.9% |
| RDW Redwire | Q3 2026 | $109M | +5% | -24.1% |
| YSS York Space Systems | Q2 2026 | $92.5M | +10% | -44.6% |
| VOYG Voyager Technologies | Q3 2026 | $88.7M | +124% | -69.8% |
| HLEO Helio | Q3 FY26 | $591K | -25% | -92.5% |
| MNTS Momentus | Q2 2026 | $25K | -87% | n/m |
Source: Rocket Lab 10-Q on SEC EDGAR · CIK 1819994 · Guided Missiles & Space Vehicles & Parts
13F: who owns RKLB and who is buying
More on RKLB
- How Rocket Lab makes money: revenue by segment
- Rocket Lab next earnings date and what analysts expect
- Rocket Lab stock forecast, price target and fair value
- Who owns Rocket Lab stock: holders, funds and Congress trades
- Is Rocket Lab a takeover target? LBO and rumors
- Rocket Lab recalls, complaints and regulation
History
Every quarter: Q2 2026 results · Q1 2026 results · Q4 2025 results · Q3 2025 results · Q2 2025 results · Q1 2025 results · Q4 2024 results