Filing Flows › Consumer Discretionary › Sherwin Williams (SHW)
Sherwin Williams (SHW) earnings and revenue breakdown
Latest: Q3 2026 · 10-Q filed Oct 27, 2026 · Sherwin Williams (SHW) Q3 2026 earnings results →
Q3 2026 Revenue up 8% year over year to $6.9B · 12¢ of every $1 of revenue kept as net profit · operating margin 15.5%
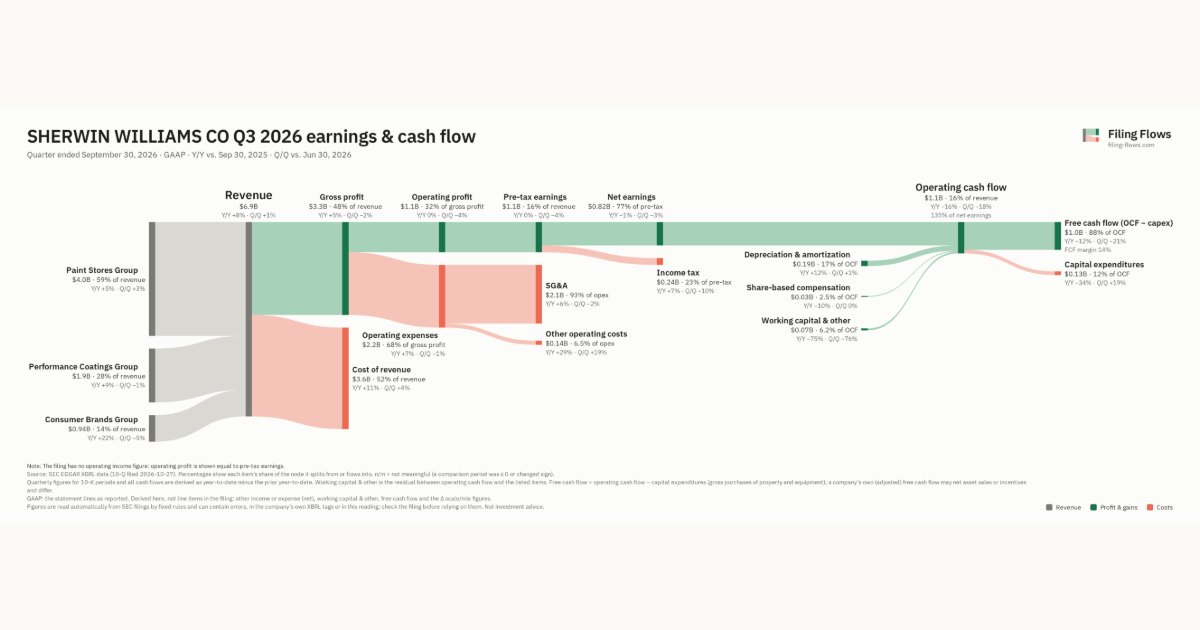
Sherwin Williams made $6.9B in Q3 2026 (+8% Y/Y): Paint Stores Group $4.0B, Performance Coatings Group $1.9B, Consumer Brands Group $937M. Operating margin 15.5%, net earnings $821M. See where every dollar goes — costs, profit and cash — as a Sankey from the 10-Q filed Oct 27, 2026.
Drawing the Sankey…
Open the interactive Sankey → click any line for what the company wrote about it, compare Y/Y and Q/Q, export as PNG or PDF
What changed this quarter
Revenue was $6.9B in Q3 2026, up 8% year over year and up 1% from the previous quarter. Paint Stores Group was the largest line at 59% of revenue. Paint Stores Group added $0.18B year over year (up 5%), 36% of the total change.
Gross margin was 47.8%, down 1.4 points from Q3 2025. Operating profit was $1.1B, a 15.5% margin (down 1.2 points year over year). Of the extra revenue versus Q3 2025, 1% reached operating profit, below the 17% margin then. Operating expenses grew 7% against revenue growth of 8%. The fastest-growing cost line was Other operating costs (+29%). Net earnings were $0.82B, down 1% year over year. The effective tax rate was 22.8%.
Operating cash flow was $1.1B (down 16% year over year), 135% of net earnings. Non-cash charges added back $0.19B of depreciation and amortization and $0.03B of share-based compensation. Working capital and other items added $0.07B. Capital expenditures of $0.13B left free cash flow of $1.0B.
Quarterly history
| Quarter | Form | Filed | Revenue | Y/Y | Op. margin | Net earnings | Op. cash flow |
|---|---|---|---|---|---|---|---|
| Q3 2026 | 10-Q | Oct 27, 2026 | $6.9B | +8% | 15.5% | $821M | $1.1B |
| Q2 2026 | 10-Q | Jul 28, 2026 | $6.8B | +8% | 16.4% | $844M | $1.3B |
| Q1 2026 | 10-Q | Apr 28, 2026 | $5.7B | +7% | 12.0% | $535M | $139M |
| Q4 2025 | 10-K | Feb 19, 2026 | $5.6B | +6% | 11.4% | $477M | $1.1B |
| Q3 2025 | 10-Q | Oct 28, 2025 | $6.4B | +3% | 16.7% | $833M | $1.3B |
| Q2 2025 | 10-Q | Jul 24, 2025 | $6.3B | +0.7% | 15.6% | $755M | $1.1B |
| Q1 2025 | 10-Q | Apr 29, 2025 | $5.3B | -1% | 12.3% | $504M | −$61.1M |
Charts
Interactive views
The same charts as the app — open one to draw it.
💵Where each $1 goesinteractive
Loading the interactive chart…
🌏Named in Asian annual reportsinteractive
Loading the interactive chart…
🔄Rotation against the market and its industry (RRG)interactive
Loading the interactive chart…
🔍Earnings qualityinteractive
Loading the interactive chart…
⚖️Fair value by methodinteractive
Loading the interactive chart…
🔭Outlook & guidanceinteractive
Loading the interactive chart…
📈Investments: gains and what it boughtinteractive
Loading the interactive chart…
🏭Its industry’s money flow (input-output)interactive
Loading the interactive chart…
About Sherwin Williams
The Sherwin-Williams Company, founded in 1866 and incorporated in Ohio in 1884, is engaged in the development, manufacture, distribution and sale of paint, coatings and related products to professional, industrial, commercial and retail customers primarily in North and South America with additional operations in the Caribbean region, Europe, Asia and Australia. Our principal executive offices are located at 1 Sherwin Way, Cleveland, Ohio 44113-2206, telephone (216) 566-2000. As used in this report, the terms “Sherwin-Williams,” “Company,” “we”, “us” and “our” mean The Sherwin-Williams Company and its consolidated subsidiaries.
In its own words, from its 10-K, filed Feb 19, 2026.
Sherwin Williams against its Retail-Building Materials, Hardware, Garden Supply peers
The largest companies of the same SEC industry, each at its latest quarter. Revenue growth: +8% against the peers' median +6%. Operating margin: 15.5% against the peers' median 7.9%.
| Company | Quarter | Revenue | Y/Y | Op. margin |
|---|---|---|---|---|
| SHW Sherwin Williams | Q3 2026 | $6.9B | +8% | 15.5% |
| TSCO Tractor Supply | Q3 2026 | $3.9B | +5% | 7.9% |
| FAST Fastenal | Q3 2026 | $2.5B | +16% | 21.5% |
| GRWG GrowGeneration | Q2 2026 | $43.2M | +6% | -5.4% |
| IPW iPower | Q4 FY26 | $1.4M | -86% | -648.0% |
Source: Sherwin Williams 10-Q on SEC EDGAR · CIK 89800 · Retail-Building Materials, Hardware, Garden Supply
Guidance and outlook
13F: who owns SHW and who is buying
More on SHW
History
Every quarter: Q3 2026 results · Q2 2026 results · Q1 2026 results · Q4 2025 results · Q3 2025 results · Q2 2025 results · Q1 2025 results
- Sherwin Williams guidance history: guided vs reported
- Sherwin Williams gross margin by quarter
- Sherwin Williams operating margin by quarter
- Sherwin Williams net income by quarter
- Sherwin Williams free cash flow by quarter
- Sherwin Williams capital expenditures by quarter
- Sherwin Williams Paint Stores Group revenue by quarter
- Sherwin Williams Performance Coatings Group revenue by quarter
- Sherwin Williams Consumer Brands Group revenue by quarter