Filing Flows › Consumer Discretionary › Fastenal (FAST)
Fastenal (FAST) earnings and revenue breakdown
Latest: Q3 2026 · 10-Q filed Oct 19, 2026 · Fastenal (FAST) Q3 2026 earnings results →
Q3 2026 Revenue up 16% year over year to $2.5B · 16¢ of every $1 of revenue kept as net profit · operating margin 21.5%
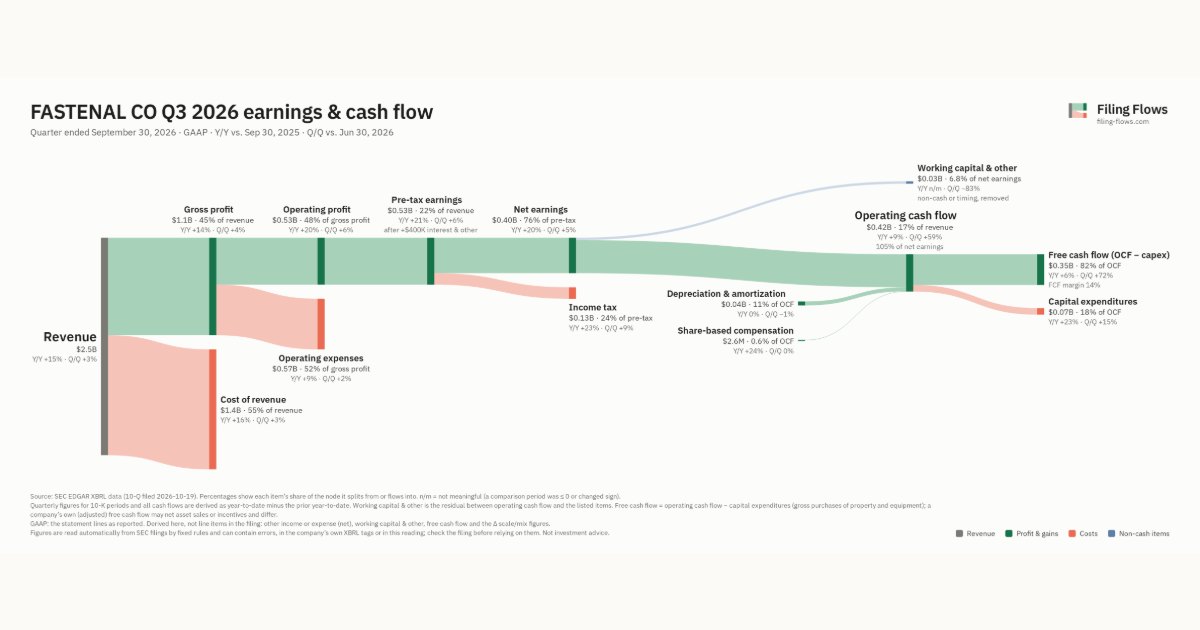
Fastenal made $2.5B in Q3 2026 (+16% Y/Y). Operating margin 21.5%, net earnings $402M. See where every dollar goes — costs, profit and cash — as a Sankey from the 10-Q filed Oct 19, 2026.
Drawing the Sankey…
Open the interactive Sankey → click any line for what the company wrote about it, compare Y/Y and Q/Q, export as PNG or PDF
What changed this quarter
Revenue was $2.5B in Q3 2026, up 15% year over year and up 3% from the previous quarter.
Gross margin was 44.8%, down 0.4 points from Q3 2025. Operating profit was $0.53B, a 21.5% margin (up 0.9 points year over year). Of the extra revenue versus Q3 2025, 27% reached operating profit, above the 21% margin then. Operating expenses grew 9% against revenue growth of 15%. Net earnings were $0.40B, up 20% year over year. The effective tax rate was 24.4%.
Operating cash flow was $0.42B (up 9% year over year), 105% of net earnings. Non-cash charges added back $0.04B of depreciation and amortization and $2.6M of share-based compensation. Working capital and other items used $0.03B. Capital expenditures of $0.07B left free cash flow of $0.35B.
Quarterly history
| Quarter | Form | Filed | Revenue | Y/Y | Op. margin | Net earnings | Op. cash flow |
|---|---|---|---|---|---|---|---|
| Q3 2026 | 10-Q | Oct 19, 2026 | $2.5B | +16% | 21.5% | $402M | $422M |
| Q2 2026 | 10-Q | Jul 16, 2026 | $2.4B | +15% | 21.0% | $383M | $266M |
| Q1 2026 | 10-Q | Apr 16, 2026 | $2.2B | +12% | 20.3% | $340M | $378M |
| Q4 2025 | 10-K | Feb 5, 2026 | $2.0B | +11% | 19.0% | $294M | $368M |
| Q3 2025 | 10-Q | Oct 16, 2025 | $2.1B | +12% | 20.7% | $336M | $387M |
| Q2 2025 | 10-Q | Jul 17, 2025 | $2.1B | +9% | 21.0% | $330M | $279M |
| Q1 2025 | 10-Q | Apr 16, 2025 | $2.0B | +3% | 20.1% | $299M | $262M |
Charts
Interactive views
The same charts as the app — open one to draw it.
💵Where each $1 goesinteractive
Loading the interactive chart…
🌏Named in Asian annual reportsinteractive
Loading the interactive chart…
🔄Rotation against the market and its industry (RRG)interactive
Loading the interactive chart…
🔍Earnings qualityinteractive
Loading the interactive chart…
⚖️Fair value by methodinteractive
Loading the interactive chart…
🔭Outlook & guidanceinteractive
Loading the interactive chart…
📈Investments: gains and what it boughtinteractive
Loading the interactive chart…
🏭Its industry’s money flow (input-output)interactive
Loading the interactive chart…
About Fastenal
Note – Information in this section is as of year end unless otherwise noted. The year end is December 31, 2025 unless additional years are included or noted. Fastenal began as a partnership in 1967, and was incorporated under the laws of Minnesota in 1968. We opened our first branch in 1967 in Winona, Minnesota, a city with a population today of approximately 26,000. We began with a marketing strategy of supplying threaded fasteners to customers through a branch network in small, medium, and, in subsequent years, large cities. Over time, how and where we engage our customers has expanded and evolved. Today we sell a broader range of industrial and construction supplies spanning more than nine major product lines through a global network of locations utilizing diverse technologies such as vending devices, bin stock devices, and eBusiness.
In its own words, from its 10-K, filed Feb 5, 2026.
Fastenal against its Retail-Building Materials, Hardware, Garden Supply peers
The largest companies of the same SEC industry, each at its latest quarter. Revenue growth: +16% against the peers' median +6%. Operating margin: 21.5% against the peers' median 7.9%.
| Company | Quarter | Revenue | Y/Y | Op. margin |
|---|---|---|---|---|
| FAST Fastenal | Q3 2026 | $2.5B | +16% | 21.5% |
| SHW Sherwin Williams | Q3 2026 | $6.9B | +8% | 15.5% |
| TSCO Tractor Supply | Q3 2026 | $3.9B | +5% | 7.9% |
| GRWG GrowGeneration | Q2 2026 | $43.2M | +6% | -5.4% |
| IPW iPower | Q4 FY26 | $1.4M | -86% | -648.0% |
Source: Fastenal 10-Q on SEC EDGAR · CIK 815556 · Retail-Building Materials, Hardware, Garden Supply
13F: who owns FAST and who is buying
More on FAST
History
Every quarter: Q3 2026 results · Q2 2026 results · Q1 2026 results · Q4 2025 results · Q3 2025 results · Q2 2025 results · Q1 2025 results