Filing Flows › Industrials › Trane Technologies (TT)
Trane Technologies (TT) earnings and revenue breakdown
Latest: Q3 2026 · 10-Q filed Oct 29, 2026 · Trane Technologies (TT) Q3 2026 earnings results →
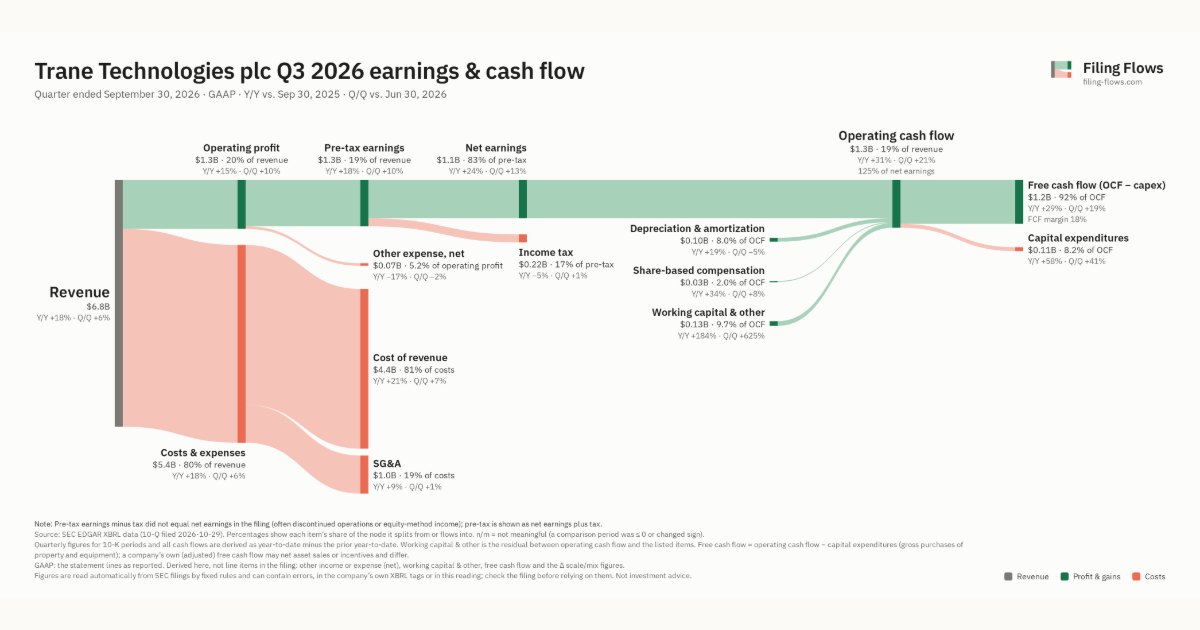
Q3 2026 Revenue up 18% year over year to $6.8B · 16¢ of every $1 of revenue kept as net profit · operating margin 19.9%
Trane Technologies made $6.8B in Q3 2026 (+18% Y/Y). Operating margin 19.9%, net earnings $1.0B. See where every dollar goes — costs, profit and cash — as a Sankey from the 10-Q filed Oct 29, 2026.
Drawing the Sankey…
Open the interactive Sankey → click any line for what the company wrote about it, compare Y/Y and Q/Q, export as PNG or PDF
What changed this quarter
Revenue was $6.8B in Q3 2026, up 18% year over year and up 6% from the previous quarter.
Operating profit was $1.3B, a 19.9% margin (down 0.4 points year over year). Of the extra revenue versus Q3 2025, 17% reached operating profit, below the 20% margin then. Total costs grew 18% against revenue growth of 18%. The fastest-growing cost line was Cost of revenue (+21%). Net earnings were $1.0B, up 24% year over year. The effective tax rate was 17.3%.
Operating cash flow was $1.3B (up 31% year over year), 125% of net earnings. Non-cash charges added back $0.10B of depreciation and amortization and $0.03B of share-based compensation. Working capital and other items added $0.13B. Capital expenditures of $0.11B left free cash flow of $1.2B.
Quarterly history
| Quarter | Form | Filed | Revenue | Y/Y | Op. margin | Net earnings | Op. cash flow |
|---|---|---|---|---|---|---|---|
| Q3 2026 | 10-Q | Oct 29, 2026 | $6.8B | +18% | 19.9% | $1.0B | $1.3B |
| Q2 2026 | 10-Q | Jul 30, 2026 | $6.4B | +11% | 19.3% | $926M | $1.1B |
| Q1 2026 | 10-Q | Apr 30, 2026 | $5.0B | +6% | 15.6% | $584M | $626M |
| Q4 2025 | 10-K | Feb 5, 2026 | $5.1B | +6% | 15.9% | $591M | $1.2B |
| Q3 2025 | 10-Q | Oct 30, 2025 | $5.7B | +6% | 20.3% | $848M | $1.0B |
| Q2 2025 | 10-Q | Jul 30, 2025 | $5.7B | +8% | 20.3% | $879M | $692M |
| Q1 2025 | 10-Q | Apr 30, 2025 | $4.7B | +11% | 17.5% | $605M | $340M |
Charts
In supply chains and themes
Interactive views
The same charts as the app — open one to draw it.
💵Where each $1 goesinteractive
Loading the interactive chart…
🌏Named in Asian annual reportsinteractive
Loading the interactive chart…
🔄Rotation against the market and its industry (RRG)interactive
Loading the interactive chart…
🔍Earnings qualityinteractive
Loading the interactive chart…
⚖️Fair value by methodinteractive
Loading the interactive chart…
🔭Outlook & guidanceinteractive
Loading the interactive chart…
📈Investments: gains and what it boughtinteractive
Loading the interactive chart…
🏭Its industry’s money flow (input-output)interactive
Loading the interactive chart…
About Trane Technologies
Trane Technologies plc, a public limited company, incorporated in Ireland in 2009, and its consolidated subsidiaries (collectively we, us, our, the Company) is a global climate innovator. We bring sustainable and efficient solutions to buildings, homes and transportation through our strategic brands, Trane ® and Thermo King ® , and our environmentally responsible portfolio of products, services and connected intelligent controls. We generate revenue and cash primarily through the design, manufacture, sales and service of solutions for Heating, Ventilation and Air Conditioning (HVAC), transport refrigeration, and custom refrigeration solutions. As an industry leader with an extensive global install base, our growth strategy includes expanding recurring revenue through services and rental options.
In its own words, from its 10-K, filed Feb 5, 2026.
Source: Trane Technologies 10-Q on SEC EDGAR · CIK 1466258 · Auto Controls For Regulating Residential & Comml Environments
More on TT
- How Trane Technologies makes money: revenue by segment
- Trane Technologies next earnings date and what analysts expect
- Trane Technologies stock forecast, price target and fair value
- Who owns Trane Technologies stock: holders, funds and Congress trades
- Trane Technologies guidance and outlook
- Is Trane Technologies a takeover target? LBO and rumors
- Trane Technologies recalls, complaints and regulation
History
Every quarter: Q3 2026 results · Q2 2026 results · Q1 2026 results · Q4 2025 results · Q3 2025 results · Q2 2025 results · Q1 2025 results