Filing Flows › Materials › Energy Fuels (UUUU)
Energy Fuels (UUUU) earnings and revenue breakdown
Latest: Q3 2026 · 10-Q filed Nov 4, 2026 · Energy Fuels (UUUU) Q3 2026 earnings results →
Q3 2026 Revenue up 65% year over year to $29.2M · 179¢ of every $1 of revenue lost · operating margin -86.7%
Energy Fuels made $29.2M in Q3 2026 (+65% Y/Y). Operating margin -86.7%, net loss $52.4M. See where every dollar goes — costs, profit and cash — as a Sankey from the 10-Q filed Nov 4, 2026.
Drawing the Sankey…
Open the interactive Sankey → click any line for what the company wrote about it, compare Y/Y and Q/Q, export as PNG or PDF
What changed this quarter
Revenue was $29.2M in Q3 2026, up 65% year over year and up 16% from the previous quarter.
Operating costs exceeded revenue by $25.3M, an operating margin of -86.7%. Total costs grew 23% against revenue growth of 65%. The fastest-growing cost line was Other operating costs (+56%). The quarter ended with a net loss of $52.4M, wider than the previous quarter's $33.6M loss. Minority interests bore $164K of it: to shareholders the quarter was a loss of $52.2M. Net interest and other expense of $27.5M was the main reason.
Operating cash flow was −$20.7M. Non-cash charges added back $2.2M of depreciation and amortization and $3.6M of share-based compensation. Working capital and other items added $25.9M. Capital expenditures of $7.7M exceeded it, leaving free cash flow of −$28.4M.
Quarterly history
| Quarter | Form | Filed | Revenue | Y/Y | Op. margin | Net earnings | Op. cash flow |
|---|---|---|---|---|---|---|---|
| Q3 2026 | 10-Q | Nov 4, 2026 | $29.2M | +65% | -86.7% | −$52.4M | −$20.7M |
| Q2 2026 | 10-Q | Aug 5, 2026 | $25.1M | +496% | -121.8% | −$33.6M | −$26.1M |
| Q1 2026 | 10-Q | May 6, 2026 | $35.8M | +112% | -47.2% | −$11.0M | $8.3M |
| Q4 2025 | 10-K | Feb 26, 2026 | $27.1M | -32% | -81.6% | −$20.9M | −$16.2M |
| Q3 2025 | 10-Q | Nov 3, 2025 | $17.7M | +338% | -150.6% | −$17.0M | −$28.5M |
| Q2 2025 | 10-Q | Aug 6, 2025 | $4.2M | -52% | -621.4% | −$21.8M | −$25.9M |
| Q1 2025 | 10-Q | May 7, 2025 | $16.9M | -34% | -155.0% | −$26.3M | −$18.8M |
Charts
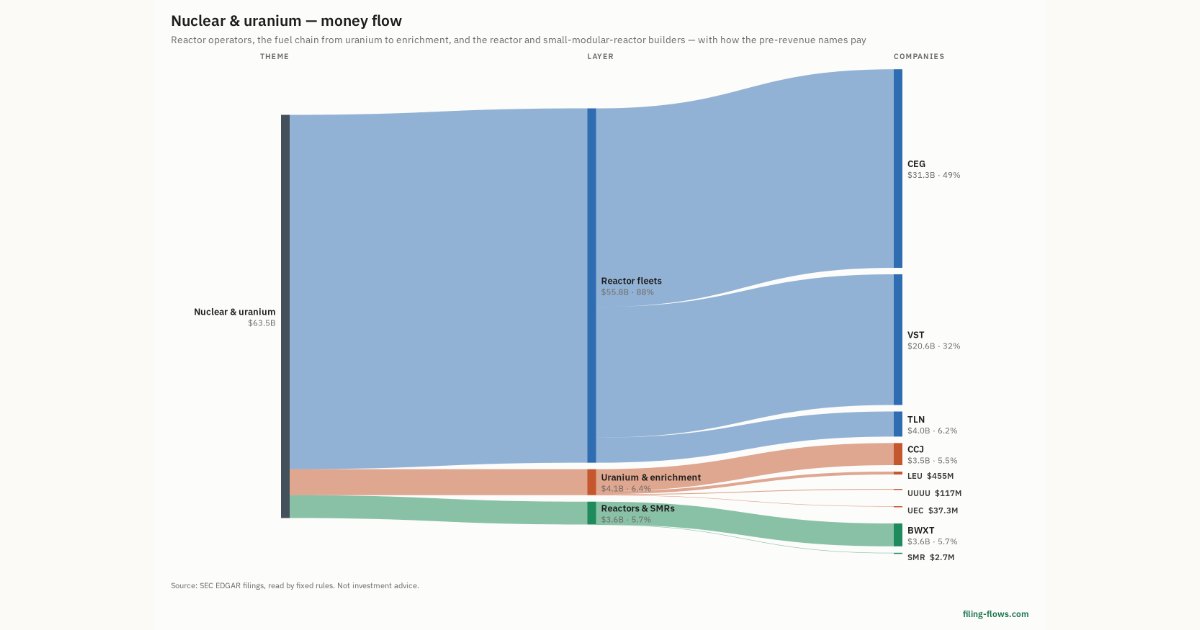
In supply chains and themes
Interactive views
The same charts as the app — open one to draw it.
💵Where each $1 goesinteractive
Loading the interactive chart…
🌏Named in Asian annual reportsinteractive
Loading the interactive chart…
🔄Rotation against the market and its industry (RRG)interactive
Loading the interactive chart…
🔍Earnings qualityinteractive
Loading the interactive chart…
⚖️Fair value by methodinteractive
Loading the interactive chart…
🔭Outlook & guidanceinteractive
Loading the interactive chart…
📈Investments: gains and what it boughtinteractive
Loading the interactive chart…
🏭Its industry’s money flow (input-output)interactive
Loading the interactive chart…
About Energy Fuels
Energy Fuels Inc. and its subsidiary companies (collectively, the “ Company ”, “ Energy Fuels ” or “ our ”) produce several of the critical materials essential to United States (“ U.S. ”) energy security and other advanced technologies, including uranium, vanadium, rare earth elements (“ REEs ”) and heavy mineral sands (“ HMS ”), in an effort to strengthen domestic supply chains and reduce reliance on foreign‑controlled sources. The White Mesa Mill (the “ White Mesa Mill ” or the “ Mill ”), located in Utah, is a key asset to strengthen domestic supply chains due to its ability to process uranium, vanadium, REE products, and, potentially, radioisotopes.
In its own words, from its 10-Q, filed Aug 5, 2026.
Energy Fuels against its Mining & Quarrying of Nonmetallic Minerals (No Fuels) peers
The largest companies of the same SEC industry, each at its latest quarter. Revenue growth: +65% against the peers' median +6%. Operating margin: -86.7% against the peers' median 16.8%.
| Company | Quarter | Revenue | Y/Y | Op. margin |
|---|---|---|---|---|
| UUUU Energy Fuels | Q3 2026 | $29.2M | +65% | -86.7% |
| MLM Martin Marietta Materials | Q3 2026 | $2.4B | +28% | 18.5% |
| VMC Vulcan Materials | Q3 2026 | $2.2B | -5% | 24.0% |
| KNF Knife River | Q3 2026 | $1.3B | +6% | 16.8% |
| HL Hecla Mining | Q3 2026 | $395M | +25% | 39.8% |
| CMP Compass Minerals International | Q3 FY26 | $215M | +0.3% | 5.1% |
| SND Smart Sand | Q2 2026 | $115M | +34% | 8.7% |
| USLM United States Lime & Minerals | Q3 2026 | $106M | +4% | 42.1% |
| LEU Centrus Energy | Q3 2026 | $55.5M | -26% | -53.5% |
Source: Energy Fuels 10-Q on SEC EDGAR · CIK 1385849 · Mining & Quarrying of Nonmetallic Minerals (No Fuels)
Guidance and outlook
13F: who owns UUUU and who is buying
More on UUUU
History
Every quarter: Q3 2026 results · Q2 2026 results · Q1 2026 results · Q4 2025 results · Q3 2025 results · Q2 2025 results · Q1 2025 results
Compare UUUU with
- Energy Fuels vs Centrus Energy (UUUU vs LEU)
- Energy Fuels vs Intrepid Potash (UUUU vs IPI)
- Energy Fuels vs ContextLogic Holdings (UUUU vs LOGC)
- Energy Fuels vs American Battery Technology (UUUU vs ABAT)
- Energy Fuels vs International Battery Metals (UUUU vs IBATF)
- Energy Fuels vs Atlas Lithium (UUUU vs ATLX)