Filing Flows › Technology › Vertiv Holdings (VRT)
Vertiv Holdings (VRT) earnings and revenue breakdown
Latest: Q3 2026 · 10-Q filed Oct 28, 2026 · Vertiv Holdings (VRT) Q3 2026 earnings results →
Q3 2026 Revenue up 61% year over year to $4.3B · 18¢ of every $1 of revenue kept as net profit · operating margin 22.8%
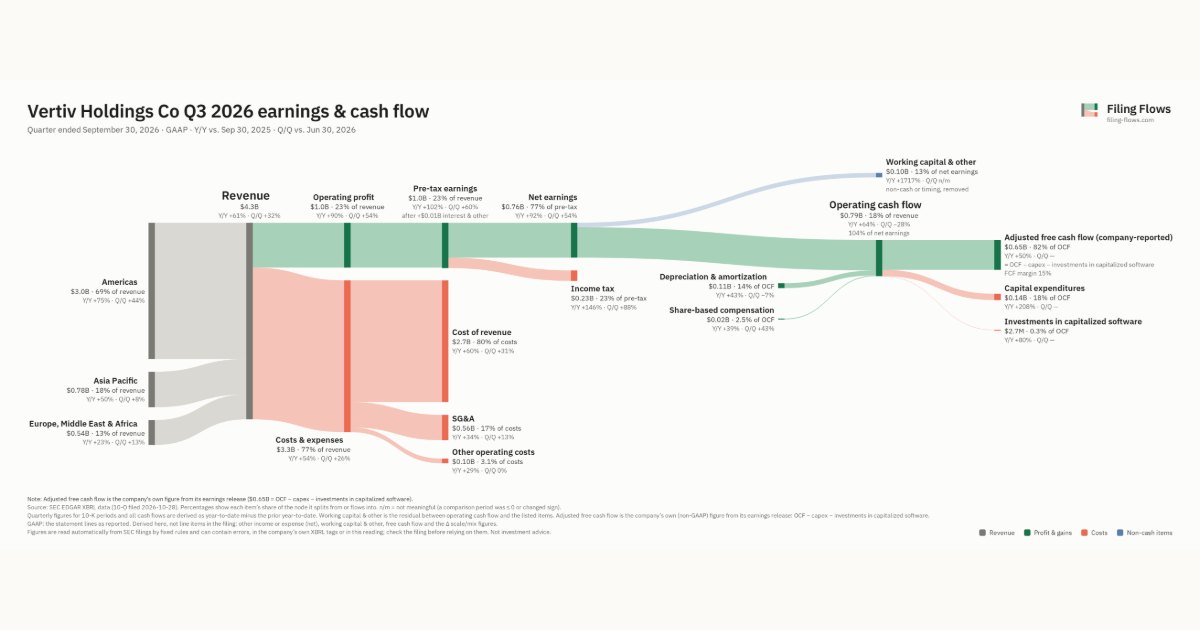
Vertiv Holdings made $4.3B in Q3 2026 (+61% Y/Y): Americas $3.0B, Asia Pacific $779M, Europe, Middle East & Africa $545M. Operating margin 22.8%, net earnings $764M. See where every dollar goes — costs, profit and cash — as a Sankey from the 10-Q filed Oct 28, 2026.
Drawing the Sankey…
Open the interactive Sankey → click any line for what the company wrote about it, compare Y/Y and Q/Q, export as PNG or PDF
What changed this quarter
Revenue was $4.3B in Q3 2026, up 61% year over year and up 32% from the previous quarter. Americas was the largest line at 69% of revenue. Americas added $1.3B year over year (up 75%), 78% of the total change.
Operating profit was $1.0B, a 22.8% margin (up 3.5 points year over year). Of the extra revenue versus Q3 2025, 29% reached operating profit, above the 19% margin then. Total costs grew 54% against revenue growth of 61%. The fastest-growing cost line was Cost of revenue (+60%). Net earnings were $0.76B, up 92% year over year. The effective tax rate was 23.2%.
Operating cash flow was $0.79B (up 64% year over year), 104% of net earnings. Non-cash charges added back $0.11B of depreciation and amortization and $0.02B of share-based compensation. Working capital and other items used $0.10B. After capital expenditures ($0.14B) and investments in capitalized software ($2.7M), adjusted free cash flow as the company reports it was $0.65B.
Quarterly history
| Quarter | Form | Filed | Revenue | Y/Y | Op. margin | Net earnings | Op. cash flow |
|---|---|---|---|---|---|---|---|
| Q3 2026 | 10-Q | Oct 28, 2026 | $4.3B | +61% | 22.8% | $764M | $794M |
| Q2 2026 | 10-Q | Jul 29, 2026 | $3.3B | +24% | 19.5% | $498M | $1.1B |
| Q1 2026 | 10-Q | Apr 22, 2026 | $2.6B | +30% | 16.6% | $390M | $767M |
| Q4 2025 | 10-K | Feb 13, 2026 | $2.9B | +23% | 20.1% | $446M | $1.0B |
| Q3 2025 | 10-Q | Oct 22, 2025 | $2.7B | +29% | 19.3% | $398M | $483M |
| Q2 2025 | 10-Q | Jul 30, 2025 | $2.6B | +35% | 16.8% | $324M | $323M |
| Q1 2025 | 10-Q | Apr 23, 2025 | $2.0B | +24% | 14.3% | $164M | $303M |
Charts
In supply chains and themes
Interactive views
The same charts as the app — open one to draw it.
💵Where each $1 goesinteractive
Loading the interactive chart…
🌏Named in Asian annual reportsinteractive
Loading the interactive chart…
🔄Rotation against the market and its industry (RRG)interactive
Loading the interactive chart…
🔍Earnings qualityinteractive
Loading the interactive chart…
⚖️Fair value by methodinteractive
Loading the interactive chart…
🔭Outlook & guidanceinteractive
Loading the interactive chart…
📈Investments: gains and what it boughtinteractive
Loading the interactive chart…
🏭Its industry’s money flow (input-output)interactive
Loading the interactive chart…
About Vertiv Holdings
Vertiv is a global leader in critical digital infrastructure for applications in data centers, communication networks, and commercial and industrial environments. As businesses, industries, and communities become more connected, we pioneer and deliver end-to-end power and cooling technologies to help our customers stay resilient, optimized, and future-ready. With our industry-leading innovative technologies and global services network, we are fueling the revolution of the digital world — keeping technology ecosystems running efficiently and without interruption. We believe that Vertiv is supercharging data’s potential; accelerating the pace of technology, raising the bar for accelerated compute and redefining the limits of densification. The world depends on data we power and cool™.
In its own words, from its 10-K, filed Feb 13, 2026.
Vertiv Holdings against its Electronic Components, NEC peers
The largest companies of the same SEC industry, each at its latest quarter. Revenue growth: +61% against the peers' median +40%. Operating margin: 22.8% against the peers' median 11.4%.
| Company | Quarter | Revenue | Y/Y | Op. margin |
|---|---|---|---|---|
| VRT Vertiv Holdings | Q3 2026 | $4.3B | +61% | 22.8% |
| AEIS Advanced Energy Industries | Q3 2026 | $696M | +50% | 20.6% |
| VREX Varex Imaging | Q3 FY26 | $210M | +4% | 10.8% |
| VICR Vicor | Q3 2026 | $197M | +78% | 36.6% |
| PI Impinj | Q3 2026 | $112M | +17% | 4.1% |
| NSYS Nortech Systems | Q2 2026 | $33.5M | +9% | 1.9% |
| MPTI M-tron Industries | Q2 2026 | $15.1M | +14% | 11.4% |
| ESP Espey Manufacturing & Electronics | Q4 FY26 | $13.5M | +40% | 25.8% |
| MVIS Microvision | Q3 2026 | $2.4M | +896% | -889.0% |
Source: Vertiv Holdings 10-Q on SEC EDGAR · CIK 1674101 · Electronic Components, NEC
13F: who owns VRT and who is buying
More on VRT
History
Every quarter: Q3 2026 results · Q2 2026 results · Q1 2026 results · Q4 2025 results · Q3 2025 results · Q2 2025 results · Q1 2025 results
- Vertiv Holdings operating margin by quarter
- Vertiv Holdings net income by quarter
- Vertiv Holdings free cash flow by quarter
- Vertiv Holdings capital expenditures by quarter
- Vertiv Holdings Americas revenue by quarter
- Vertiv Holdings Asia Pacific revenue by quarter
- Vertiv Holdings Europe, Middle East & Africa revenue by quarter