Filing Flows › Industrials › Waters (WAT)
Waters (WAT) earnings and revenue breakdown
Latest: Q3 2026 · 8-K filed Nov 3, 2026
Q3 2026 Revenue up 121% year over year to $1.8B · 5¢ of every $1 of revenue kept as net profit · operating margin 7.2%
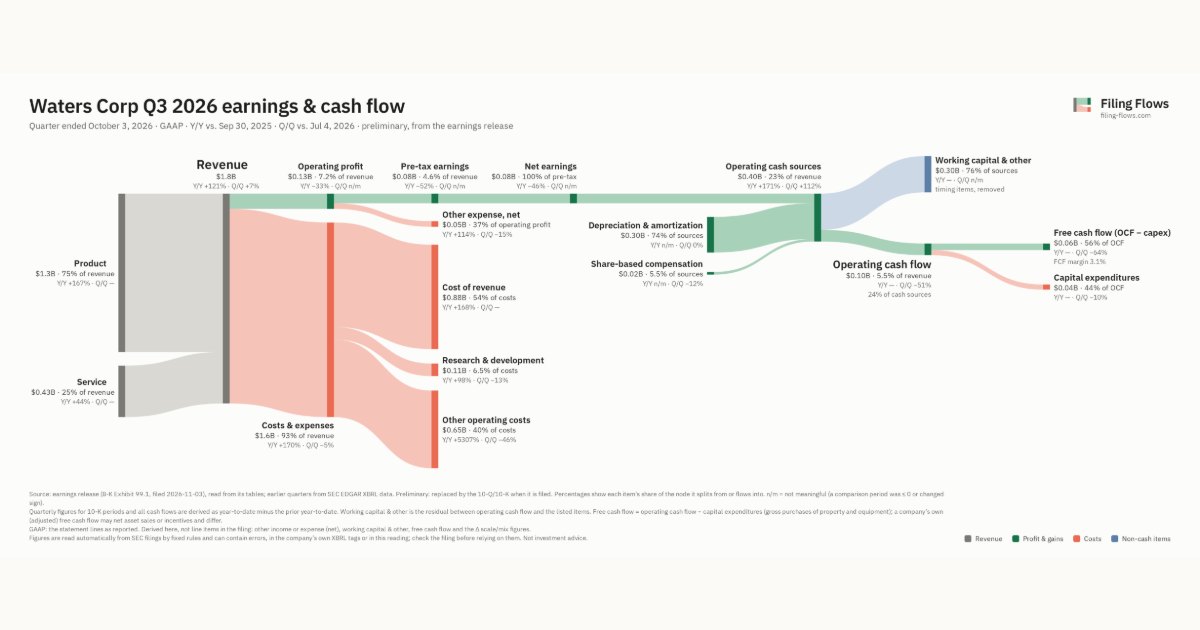
Waters made $1.8B in Q3 2026 (+121% Y/Y): Product $1.3B, Service $433M. Operating margin 7.2%, net earnings $81.0M. See where every dollar goes — costs, profit and cash — as a Sankey from the 8-K filed Nov 3, 2026 (preliminary, from the earnings release).
Drawing the Sankey…
Open the interactive Sankey → click any line for what the company wrote about it, compare Y/Y and Q/Q, export as PNG or PDF
What changed this quarter
Revenue was $1.8B in Q3 2026, up 121% year over year and up 7% from the previous quarter. Product was the largest line at 75% of revenue. Product added $0.83B year over year (up 167%), 86% of the total change.
Operating profit was $0.13B, a 7.2% margin (down 16.8 points year over year). Operating profit fell $0.06B even though revenue rose $1.0B versus a year earlier, so costs grew faster than sales. Total costs grew 170% against revenue growth of 121%. The fastest-growing cost line was Other operating costs (+5307%). Net earnings were $0.08B, down 46% year over year. The effective tax rate was 0.0%.
Operating cash flow was $0.10B, 121% of net earnings. Non-cash charges added back $0.30B of depreciation and amortization and $0.02B of share-based compensation. Working capital and other items used $0.30B. Capital expenditures of $0.04B left free cash flow of $0.06B.
Quarterly history
| Quarter | Form | Filed | Revenue | Y/Y | Op. margin | Net earnings | Op. cash flow |
|---|---|---|---|---|---|---|---|
| Q3 2026 | 8-K | Nov 3, 2026 | $1.8B | +121% | 7.2% | $81.0M | $98.0M |
| Q2 2026 | 10-Q | Aug 11, 2026 | $1.6B | +113% | -5.2% | −$136M | $201M |
| Q1 2026 | 10-Q | May 12, 2026 | $1.3B | +92% | -3.7% | −$72.0M | −$3.0M |
| Q4 2025 | 10-K | Feb 23, 2026 | $932M | +7% | 29.0% | $225M | $165M |
| Q3 2025 | 10-Q | Nov 4, 2025 | $800M | +8% | 24.0% | $149M | $187M |
| Q2 2025 | 10-Q | Aug 4, 2025 | $771M | +9% | 24.4% | $147M | $41.0M |
| Q1 2025 | 10-Q | May 6, 2025 | $662M | +4% | 23.0% | $121M | $260M |
Charts
Interactive views
The same charts as the app — open one to draw it.
💵Where each $1 goesinteractive
Loading the interactive chart…
🌏Named in Asian annual reportsinteractive
Loading the interactive chart…
🔄Rotation against the market and its industry (RRG)interactive
Loading the interactive chart…
🔍Earnings qualityinteractive
Loading the interactive chart…
⚖️Fair value by methodinteractive
Loading the interactive chart…
🔭Outlook & guidanceinteractive
Loading the interactive chart…
📈Investments: gains and what it boughtinteractive
Loading the interactive chart…
🏭Its industry’s money flow (input-output)interactive
Loading the interactive chart…
About Waters
Waters Corporation (the “Company,” “we,” “our,” or “us”), a global leader in analytical instruments and software, has pioneered innovations in chromatography, mass spectrometry and thermal analysis serving life, materials and food sciences for more than 65 years. The Company primarily designs, manufactures, sells and services high-performance liquid chromatography (“HPLC”), ultra-performance liquid chromatography (“UPLC” and together with HPLC, referred to as “LC”) and mass spectrometry (“MS”) technology systems and support products, including chromatography columns, other consumable products and comprehensive post-warranty service plans. These systems are complementary products that are frequently employed together (“LC-MS”) and sold as integrated instrument systems using common software platforms.
In its own words, from its 10-K, filed Feb 23, 2026.
Waters against its Laboratory Analytical Instruments peers
The largest companies of the same SEC industry, each at its latest quarter. Revenue growth: +121% against the peers' median +4%. Operating margin: 7.2% against the peers' median 8.2%.
| Company | Quarter | Revenue | Y/Y | Op. margin |
|---|---|---|---|---|
| WAT Waters | Q3 2026 | $1.8B | +121% | 7.2% |
| A Agilent Technologies | Q3 FY26 | $1.9B | +8% | 23.6% |
| AVTR Avantor | Q3 2026 | $1.7B | +5% | 8.2% |
| ILMN Illumina | Q3 2026 | $1.1B | +4% | 27.0% |
| MTD Mettler Toledo International | Q3 2026 | $1.1B | +6% | 27.4% |
| BRKR Bruker | Q3 2026 | $874M | +2% | -10.4% |
| RVTY Revvity | Q3 2026 | $729M | +4% | 10.6% |
| BIO Bio-Rad Laboratories | Q3 2026 | $656M | +0.5% | -7.6% |
| TXG 10x Genomics | Q3 2026 | $151M | +1% | -10.7% |
Source: Waters 8-K on SEC EDGAR · CIK 1000697 · Laboratory Analytical Instruments
Guidance and outlook
13F: who owns WAT and who is buying
More on WAT
History
Every quarter: Q3 2026 results · Q2 2026 results · Q1 2026 results · Q4 2025 results · Q3 2025 results · Q2 2025 results · Q1 2025 results