Filing Flows › Utilities › Waste Connections (WCN)
Waste Connections (WCN) earnings and revenue breakdown
Latest: Q3 2026 · 10-Q filed Oct 22, 2026 · Waste Connections (WCN) Q3 2026 earnings results →
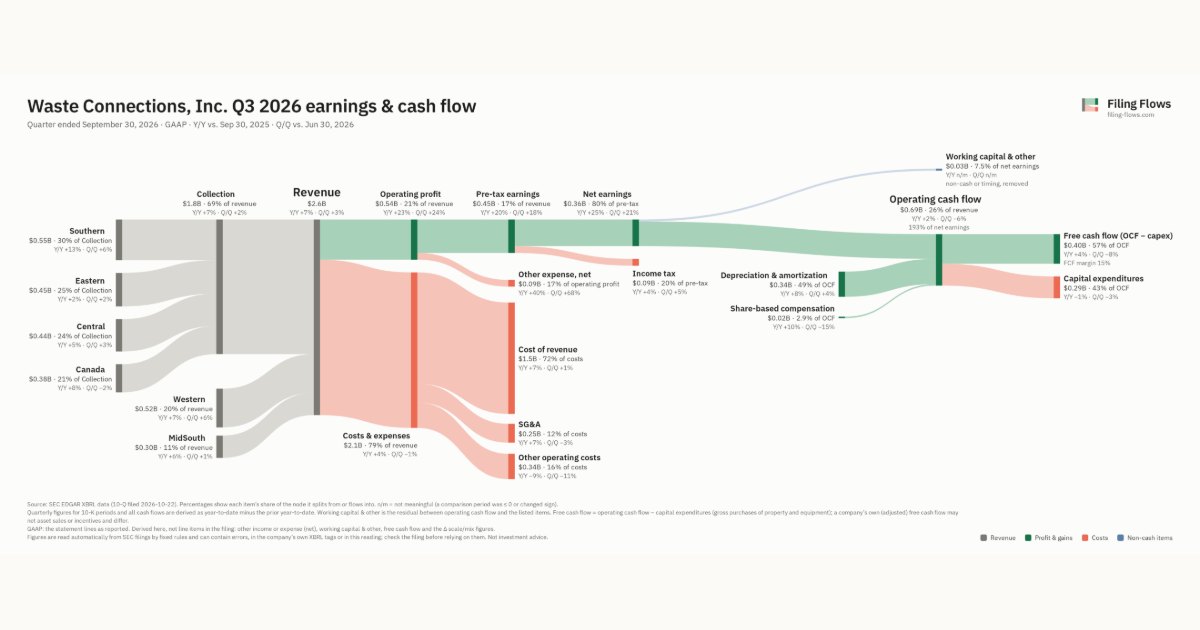
Q3 2026 Revenue up 7% year over year to $2.6B · 14¢ of every $1 of revenue kept as net profit · operating margin 20.5%
Waste Connections made $2.6B in Q3 2026 (+7% Y/Y): Collection $1.8B, Western $522M, MidSouth $301M. Operating margin 20.5%, net earnings $359M. See where every dollar goes — costs, profit and cash — as a Sankey from the 10-Q filed Oct 22, 2026.
Drawing the Sankey…
Open the interactive Sankey → click any line for what the company wrote about it, compare Y/Y and Q/Q, export as PNG or PDF
What changed this quarter
Revenue was $2.6B in Q3 2026, up 7% year over year and up 3% from the previous quarter. Southern was the largest line at 21% of revenue. Southern added $0.06B year over year (up 13%), 35% of the total change.
Operating profit was $0.54B, a 20.5% margin (up 2.7 points year over year). Of the extra revenue versus Q3 2025, 57% reached operating profit, above the 18% margin then. Total costs grew 4% against revenue growth of 7%. Net earnings were $0.36B, up 25% year over year. The effective tax rate was 20.4%.
Operating cash flow was $0.69B (up 2% year over year), 193% of net earnings. Non-cash charges added back $0.34B of depreciation and amortization and $0.02B of share-based compensation. Capital expenditures of $0.29B left free cash flow of $0.40B.
Quarterly history
| Quarter | Form | Filed | Revenue | Y/Y | Op. margin | Net earnings | Op. cash flow |
|---|---|---|---|---|---|---|---|
| Q3 2026 | 10-Q | Oct 22, 2026 | $2.6B | +7% | 20.5% | $359M | $692M |
| Q2 2026 | 10-Q | Jul 23, 2026 | $2.6B | +6% | 17.1% | $296M | $733M |
| Q1 2026 | 10-Q | Apr 23, 2026 | $2.4B | +6% | 15.4% | $219M | $546M |
| Q4 2025 | 10-K | Feb 12, 2026 | $2.4B | +5% | 17.7% | $258M | $557M |
| Q3 2025 | 10-Q | Oct 22, 2025 | $2.5B | +5% | 17.9% | $286M | $677M |
| Q2 2025 | 10-Q | Jul 24, 2025 | $2.4B | +7% | 19.1% | $290M | $638M |
| Q1 2025 | 10-Q | Apr 24, 2025 | $2.2B | +8% | 17.5% | $242M | $542M |
Charts
Interactive views
The same charts as the app — open one to draw it.
💵Where each $1 goesinteractive
Loading the interactive chart…
🌏Named in Asian annual reportsinteractive
Loading the interactive chart…
🔄Rotation against the market and its industry (RRG)interactive
Loading the interactive chart…
🔍Earnings qualityinteractive
Loading the interactive chart…
⚖️Fair value by methodinteractive
Loading the interactive chart…
🔭Outlook & guidanceinteractive
Loading the interactive chart…
📈Investments: gains and what it boughtinteractive
Loading the interactive chart…
🏭Its industry’s money flow (input-output)interactive
Loading the interactive chart…
About Waste Connections
This Annual Report on Form 10-K contains forward-looking statements based on expectations, estimates, and projections as of the date of this filing. Actual results may differ materially from those expressed in forward-looking statements. See Item 7 of Part II – “Management’s Discussion and Analysis of Financial Condition and Results of Operations.” All references to “dollars” or “$” used herein refer to U.S. dollars, and all references to “CAD $” used herein refer to Canadian dollars, unless otherwise stated. Waste Connections, Inc. is the third largest solid waste services company in North America, providing non-hazardous waste collection, transfer and disposal services, including by rail, along with resource recovery primarily through recycling and renewable fuels generation, in 46 states in the U.S. and six provinces in Canada.
In its own words, from its 10-K, filed Feb 12, 2026.
Waste Connections against its Refuse Systems peers
The largest companies of the same SEC industry, each at its latest quarter. Revenue growth: +7% against the peers' median +7%. Operating margin: 20.5% against the peers' median 7.2%.
| Company | Quarter | Revenue | Y/Y | Op. margin |
|---|---|---|---|---|
| WCN Waste Connections | Q3 2026 | $2.6B | +7% | 20.5% |
| WM Waste Management | Q3 2026 | $6.8B | +6% | 18.7% |
| RSG Republic Services | Q3 2026 | $5.2B | +8% | 17.7% |
| CWST Casella Waste Systems | Q2 2026 | $544M | +17% | 3.7% |
| NVRI Enviri | Q3 2026 | $325M | +0.1% | 7.2% |
| QRHC Quest Resource Holding | Q3 2026 | $63.8M | +0.7% | 2.7% |
| VIVK Vivakor | Q2 2026 | $32.1M | +10% | 0.5% |
| AWX Avalon Holdings | Q3 2026 | $24.3M | -6% | 13.0% |
| RENX RenX Enterprises | Q2 2026 | $4.3M | +203% | -70.4% |
Source: Waste Connections 10-Q on SEC EDGAR · CIK 1318220 · Refuse Systems
Guidance and outlook
13F: who owns WCN and who is buying
More on WCN
- How Waste Connections makes money: revenue by segment
- Waste Connections stock forecast, price target and fair value
- Who owns Waste Connections stock: holders, funds and Congress trades
- Waste Connections guidance and outlook
- Is Waste Connections a takeover target? LBO and rumors
- Waste Connections recalls, complaints and regulation
History
Every quarter: Q3 2026 results · Q2 2026 results · Q1 2026 results · Q4 2025 results · Q3 2025 results · Q2 2025 results · Q1 2025 results
- Waste Connections guidance history: guided vs reported
- Waste Connections operating margin by quarter
- Waste Connections net income by quarter
- Waste Connections free cash flow by quarter
- Waste Connections capital expenditures by quarter
- Waste Connections Western revenue by quarter
- Waste Connections MidSouth revenue by quarter