Filing Flows › Industrials › Xylem (XYL)
Xylem (XYL) earnings and revenue breakdown
Latest: Q3 2026 · 10-Q filed Oct 27, 2026 · Xylem (XYL) Q3 2026 earnings results →
Q3 2026 Revenue down 3% year over year to $2.2B · 13¢ of every $1 of revenue kept as net profit · operating margin 17.5%
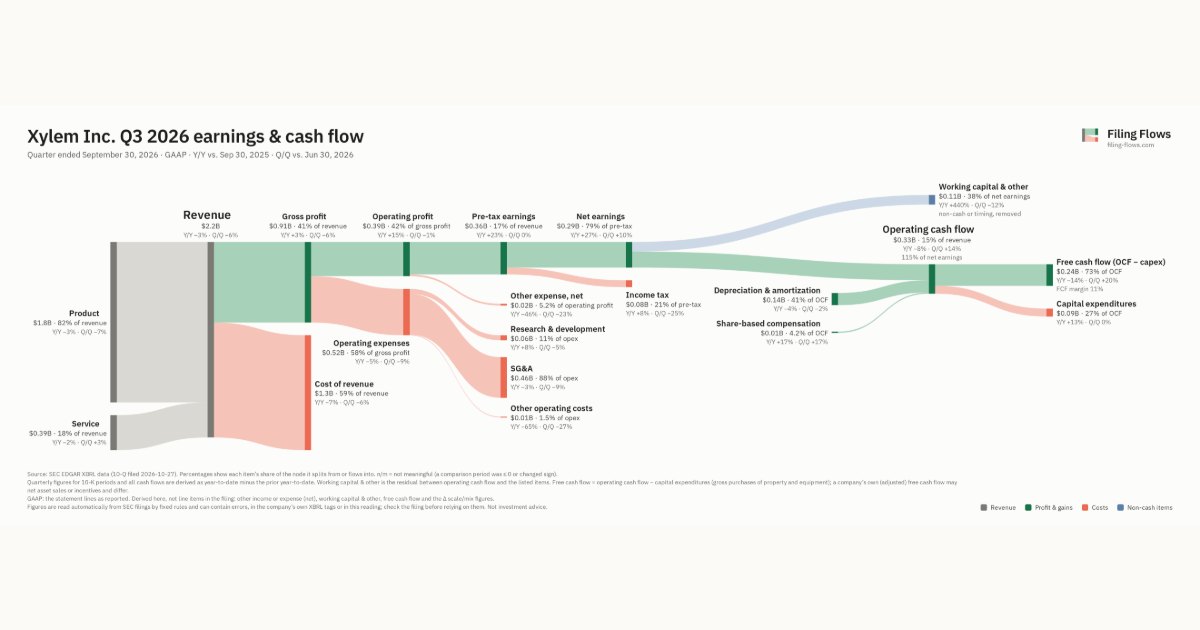
Xylem made $2.2B in Q3 2026 (-3% Y/Y): Product $1.8B, Service $394M. Operating margin 17.5%, net earnings $291M. See where every dollar goes — costs, profit and cash — as a Sankey from the 10-Q filed Oct 27, 2026.
Drawing the Sankey…
Open the interactive Sankey → click any line for what the company wrote about it, compare Y/Y and Q/Q, export as PNG or PDF
What changed this quarter
Revenue was $2.2B in Q3 2026, down 3% year over year and down 6% from the previous quarter. Product was the largest line at 82% of revenue. Product lost $0.06B year over year (down 3%), 90% of the total change.
Gross margin was 41.2%, up 2.3 points from Q3 2025. Operating profit was $0.39B, a 17.5% margin (up 2.8 points year over year). Operating expenses fell 5% while revenue fell 3%. Net earnings were $0.29B, up 28% year over year ($0.29B including minority interests, which bore $3.0M of losses). The effective tax rate was 21.1%.
Operating cash flow was $0.33B (down 8% year over year), 115% of net earnings. Non-cash charges added back $0.14B of depreciation and amortization and $0.01B of share-based compensation. Working capital and other items used $0.11B. Capital expenditures of $0.09B left free cash flow of $0.24B.
Quarterly history
| Quarter | Form | Filed | Revenue | Y/Y | Op. margin | Net earnings | Op. cash flow |
|---|---|---|---|---|---|---|---|
| Q3 2026 | 10-Q | Oct 27, 2026 | $2.2B | -3% | 17.5% | $291M | $331M |
| Q2 2026 | 10-Q | Jul 28, 2026 | $2.3B | +2% | 16.7% | $263M | $290M |
| Q1 2026 | 10-Q | Apr 28, 2026 | $2.1B | +3% | 11.5% | $193M | $108M |
| Q4 2025 | 10-K | Feb 25, 2026 | $2.4B | +6% | 14.7% | $333M | $543M |
| Q3 2025 | 10-Q | Oct 28, 2025 | $2.3B | +8% | 14.7% | $226M | $360M |
| Q2 2025 | 10-Q | Jul 31, 2025 | $2.3B | +6% | 13.3% | $224M | $305M |
| Q1 2025 | 10-Q | Apr 29, 2025 | $2.1B | +2% | 11.2% | $167M | $33.0M |
Charts
Interactive views
The same charts as the app — open one to draw it.
💵Where each $1 goesinteractive
Loading the interactive chart…
🌏Named in Asian annual reportsinteractive
Loading the interactive chart…
🔄Rotation against the market and its industry (RRG)interactive
Loading the interactive chart…
🔍Earnings qualityinteractive
Loading the interactive chart…
⚖️Fair value by methodinteractive
Loading the interactive chart…
🔭Outlook & guidanceinteractive
Loading the interactive chart…
📈Investments: gains and what it boughtinteractive
Loading the interactive chart…
🏭Its industry’s money flow (input-output)interactive
Loading the interactive chart…
About Xylem
Xylem is a leading global water technology company with 2025 revenues of $9.0 billion and approximately 22,000 employees worldwide. We design, manufacture and service engineered products and solutions across a wide variety of critical applications, primarily in the water sector. Our broad portfolio of products, services and solutions addresses customer needs of scarcity, resilience, quality, and affordability across the water cycle, from the delivery, treatment, measurement and use of drinking water, to the collection, testing, analysis and treatment of wastewater, to the return of water to the environment.
In its own words, from its 10-K, filed Feb 25, 2026.
Xylem against its Pumps & Pumping Equipment peers
The largest companies of the same SEC industry, each at its latest quarter. Revenue growth: -3% against the peers' median +8%. Operating margin: 17.5% against the peers' median 17.5%.
| Company | Quarter | Revenue | Y/Y | Op. margin |
|---|---|---|---|---|
| XYL Xylem | Q3 2026 | $2.2B | -3% | 17.5% |
| ITT ITT | Q3 2026 | $1.4B | +44% | 15.7% |
| IEX IDEX | Q3 2026 | $952M | +8% | 21.9% |
| GGG Graco | Q3 2026 | $586M | +8% | 25.3% |
| GRC Gorman Rupp | Q3 2026 | $193M | +12% | 17.5% |
| AP Ampco Pittsburgh | Q2 2026 | $103M | -9% | 4.9% |
Source: Xylem 10-Q on SEC EDGAR · CIK 1524472 · Pumps & Pumping Equipment
Guidance and outlook
13F: who owns XYL and who is buying
More on XYL
History
Every quarter: Q3 2026 results · Q2 2026 results · Q1 2026 results · Q4 2025 results · Q3 2025 results · Q2 2025 results · Q1 2025 results