Filing Flows › Materials › Alcoa (AA)
Alcoa (AA) earnings and revenue breakdown
Latest: Q3 2026 · 10-Q filed Oct 29, 2026 · Alcoa (AA) Q3 2026 earnings results →
Q3 2026 Revenue up 24% year over year to $3.7B · 13¢ of every $1 of revenue kept as net profit · operating margin 15.5%
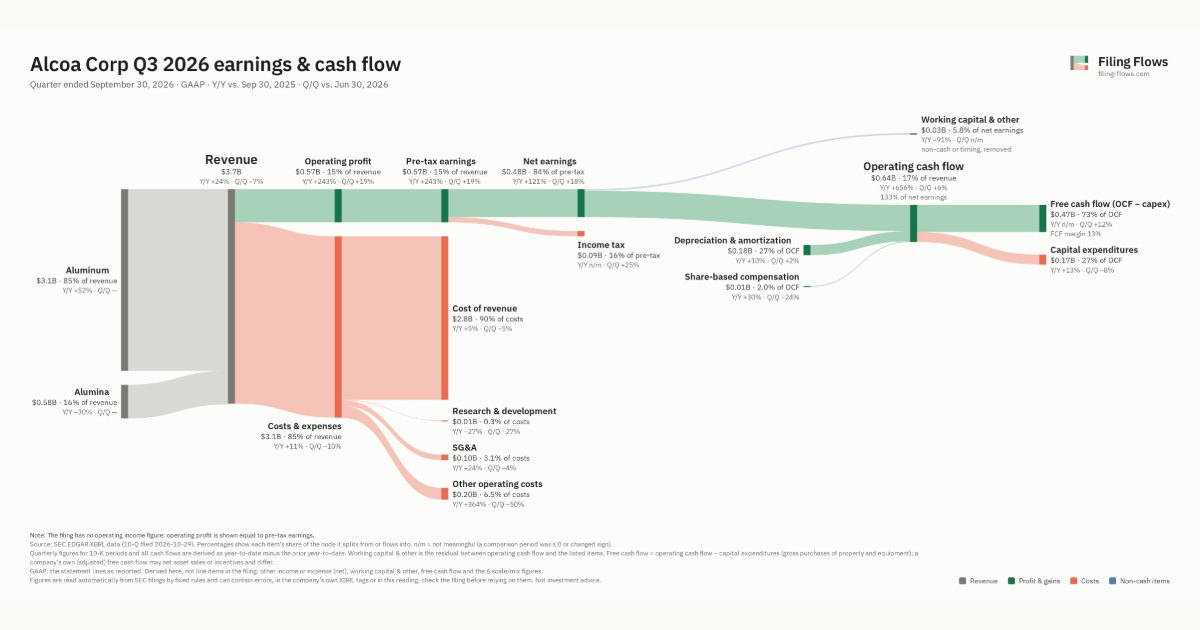
Alcoa made $3.7B in Q3 2026 (+24% Y/Y): Aluminum $3.1B, Alumina $581M. Operating margin 15.5%, net earnings $483M. See where every dollar goes — costs, profit and cash — as a Sankey from the 10-Q filed Oct 29, 2026.
Drawing the Sankey…
Open the interactive Sankey → click any line for what the company wrote about it, compare Y/Y and Q/Q, export as PNG or PDF
What changed this quarter
Revenue was $3.7B in Q3 2026, up 24% year over year and down 7% from the previous quarter. Aluminum was the largest line at 85% of revenue. Aluminum added $1.1B year over year (up 52%), 151% of the total change. Alumina declined 30%.
Operating profit was $0.57B, a 15.5% margin (up 9.9 points year over year). Of the extra revenue versus Q3 2025, 57% reached operating profit, above the 6% margin then. Total costs grew 11% against revenue growth of 24%. The fastest-growing cost line was Other operating costs (+364%). Net earnings were $0.48B, up 108% year over year. The effective tax rate was 15.9%.
Operating cash flow was $0.64B (up 656% year over year), 133% of net earnings. Non-cash charges added back $0.18B of depreciation and amortization and $0.01B of share-based compensation. Capital expenditures of $0.17B left free cash flow of $0.47B.
Quarterly history
| Quarter | Form | Filed | Revenue | Y/Y | Op. margin | Net earnings | Op. cash flow |
|---|---|---|---|---|---|---|---|
| Q3 2026 | 10-Q | Oct 29, 2026 | $3.7B | +24% | 15.5% | $483M | $643M |
| Q2 2026 | 10-Q | Jul 30, 2026 | $4.0B | +31% | 12.2% | $407M | $608M |
| Q1 2026 | 10-Q | Apr 30, 2026 | $3.2B | -5% | 15.6% | $425M | −$179M |
| Q4 2025 | 10-K | Feb 26, 2026 | $3.4B | -1% | 2.0% | $213M | $537M |
| Q3 2025 | 10-Q | Oct 28, 2025 | $3.0B | +3% | 5.6% | $232M | $85.0M |
| Q2 2025 | 10-Q | Jul 31, 2025 | $3.0B | +4% | 5.3% | $164M | $488M |
| Q1 2025 | 10-Q | May 1, 2025 | $3.4B | +30% | 19.8% | $548M | $75.0M |
Charts
Interactive views
The same charts as the app — open one to draw it.
💵Where each $1 goesinteractive
Loading the interactive chart…
🌏Named in Asian annual reportsinteractive
Loading the interactive chart…
🔄Rotation against the market and its industry (RRG)interactive
Loading the interactive chart…
🔍Earnings qualityinteractive
Loading the interactive chart…
⚖️Fair value by methodinteractive
Loading the interactive chart…
🔭Outlook & guidanceinteractive
Loading the interactive chart…
📈Investments: gains and what it boughtinteractive
Loading the interactive chart…
🏭Its industry’s money flow (input-output)interactive
Loading the interactive chart…
Customers and suppliers named in filings
Sells to
About Alcoa
Alcoa Corporation is a global industry leader in bauxite, alumina and aluminum products with a vision to build a legacy of excellence for future generations. With a values-based approach that encompasses integrity, operating excellence, care for people and courageous leadership, our purpose is to Turn Raw Potential into Real Progress. Since developing the process that made aluminum an affordable and vital part of modern life, our talented Alcoans have developed breakthrough innovations and best practices that have led to greater safety, efficiency, sustainability and stronger communities wherever we operate. Discover more by visiting www.alcoa.com. Follow us on our social media channels: Facebook, Instagram, X, YouTube and LinkedIn.
In its own words, from its 8-K, filed Jul 16, 2026.
Alcoa against its Primary Production of Aluminum peers
The largest companies of the same SEC industry, each at its latest quarter.
| Company | Quarter | Revenue | Y/Y | Op. margin |
|---|---|---|---|---|
| AA Alcoa | Q3 2026 | $3.7B | +24% | 15.5% |
| CENX Century Aluminum | Q3 2026 | $961M | +52% | 30.4% |
Source: Alcoa 10-Q on SEC EDGAR · CIK 1675149 · Primary Production of Aluminum
13F: who owns AA and who is buying
More on AA
History
Every quarter: Q3 2026 results · Q2 2026 results · Q1 2026 results · Q4 2025 results · Q3 2025 results · Q2 2025 results · Q1 2025 results