Filing Flows › Industrials › AECOM (ACM)
AECOM (ACM) earnings and revenue breakdown
Latest: Q4 FY25 · 10-K filed Nov 19, 2025 · AECOM (ACM) Q4 FY25 earnings results →
Q4 FY25 Revenue up 2% year over year to $4.2B · 3¢ of every $1 of revenue kept as net profit · operating margin 5.7%
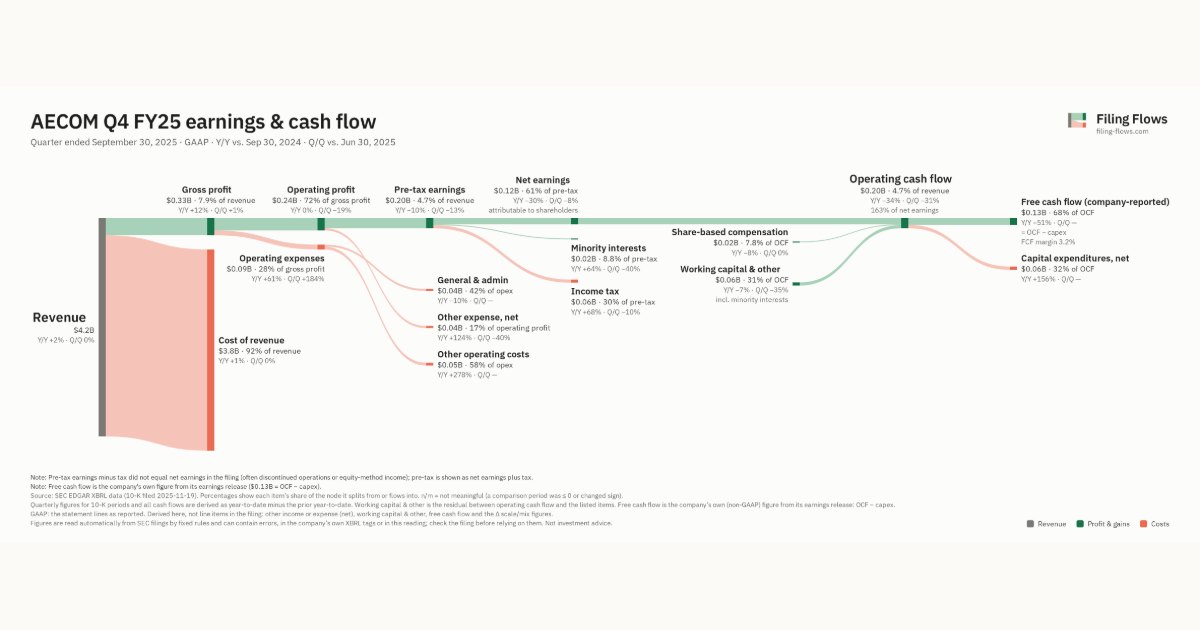
AECOM made $4.2B in Q4 FY25 (+2% Y/Y). Operating margin 5.7%, net earnings $120M. See where every dollar goes — costs, profit and cash — as a Sankey from the 10-K filed Nov 19, 2025.
Drawing the Sankey…
Open the interactive Sankey → click any line for what the company wrote about it, compare Y/Y and Q/Q, export as PNG or PDF
What changed this quarter
Revenue was $4.2B in Q4 FY25, up 2% year over year and roughly flat from the previous quarter.
Gross margin was 7.9%, up 0.8 points from Q4 FY24. Operating profit was $0.24B, a 5.7% margin (down 0.1 points year over year). Of the extra revenue versus Q4 FY24, 2% reached operating profit, below the 6% margin then. Operating expenses grew 61% against revenue growth of 2%. The fastest-growing cost line was Other operating costs (+278%). Net earnings were $0.12B, down 30% year over year. The effective tax rate was 29.8%.
Operating cash flow was $0.20B (down 34% year over year), 142% of net income including minority interests. Non-cash charges added back $0.05B of depreciation and amortization and $0.02B of share-based compensation. After capital expenditures, net ($0.06B), free cash flow as the company reports it was $0.13B.
Quarterly history
| Quarter | Form | Filed | Revenue | Y/Y | Op. margin | Net earnings | Op. cash flow |
|---|---|---|---|---|---|---|---|
| Q4 FY25 | 10-K | Nov 19, 2025 | $4.2B | +2% | 5.7% | $120M | $196M |
| Q3 FY25 | 10-Q | Aug 5, 2025 | $4.2B | +0.7% | 7.0% | $131M | $284M |
| Q2 FY25 | 10-Q | May 6, 2025 | $3.8B | -4% | 6.8% | $143M | $191M |
| Q4 FY24 | 10-K | Nov 19, 2024 | $4.1B | +7% | 5.8% | $173M | $299M |
Charts
Interactive views
The same charts as the app — open one to draw it.
💵Where each $1 goesinteractive
Loading the interactive chart…
🌏Named in Asian annual reportsinteractive
Loading the interactive chart…
🔄Rotation against the market and its industry (RRG)interactive
Loading the interactive chart…
🔍Earnings qualityinteractive
Loading the interactive chart…
⚖️Fair value by methodinteractive
Loading the interactive chart…
🔭Outlook & guidanceinteractive
Loading the interactive chart…
📈Investments: gains and what it boughtinteractive
Loading the interactive chart…
🏭Its industry’s money flow (input-output)interactive
Loading the interactive chart…
Customers and suppliers named in filings
Sells to
- U.S. government — 7% of its revenue · Stated in 10-K (sentence) · source
About AECOM
In this report, we use the terms “the Company,” “we,” “us” and “our” to refer to AECOM and its consolidated subsidiaries. Unless otherwise noted, references to years are for fiscal years. Our fiscal year consists of 52 or 53 weeks, ending on the Friday closest to September 30. For clarity of presentation, we present all periods as if the year ended on September 30. We refer to the fiscal year ended September 30, 2024 as “fiscal 2024” and the fiscal year ended September 30, 2025 as “fiscal 2025.” We are a leading global provider of professional infrastructure consulting and advisory services for governments, businesses and organizations throughout the world.
In its own words, from its 10-K, filed Nov 19, 2025.
AECOM against its Services-Engineering Services peers
The largest companies of the same SEC industry, each at its latest quarter. Revenue growth: +2% against the peers' median +5%. Operating margin: 5.7% against the peers' median 7.6%.
| Company | Quarter | Revenue | Y/Y | Op. margin |
|---|---|---|---|---|
| ACM AECOM | Q4 FY25 | $4.2B | +2% | 5.7% |
| TTEK Tetra Tech | Q3 FY26 | $1.3B | -4% | 12.1% |
| VSEC VSE | Q3 2026 | $541M | +91% | 14.3% |
| WLDN Willdan Group | Q3 2026 | $215M | +18% | 7.6% |
| MG Mistras Group | Q3 2026 | $205M | +5% | 7.4% |
| ACFN Acorn Energy | Q3 2026 | $2.6M | +5% | 7.3% |
| HYOR HyOrc | Q2 2026 | $24K | — | 100.0% |
| OFAL OFA | Q1 FY27 | $15K | -22% | n/m |
Source: AECOM 10-K on SEC EDGAR · CIK 868857 · Services-Engineering Services
13F: who owns ACM and who is buying
More on ACM
History
Every quarter: Q4 FY25 results · Q3 FY25 results · Q2 FY25 results · Q4 FY24 results