Filing Flows › Industrials › Accenture (ACN)
Accenture (ACN) earnings and revenue breakdown
Latest: Q4 FY26 · 10-K filed Oct 16, 2026 · Accenture (ACN) Q4 FY26 earnings results →
Q4 FY26 Revenue up 6% year over year to $18.7B · 11¢ of every $1 of revenue kept as net profit · operating margin 15.3%
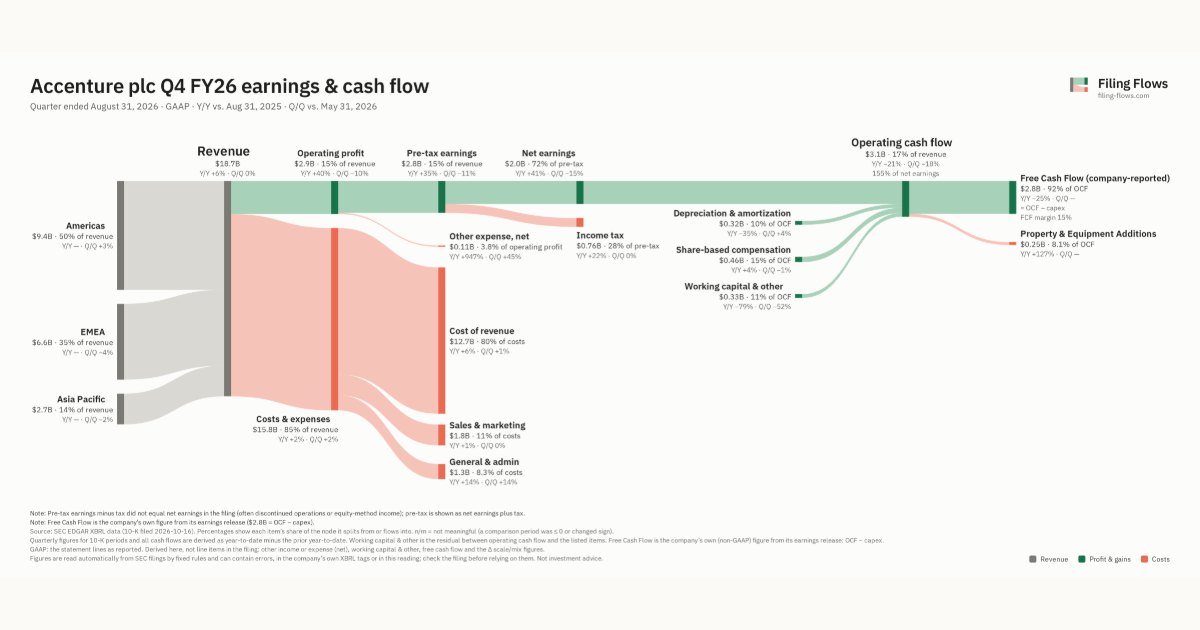
Accenture made $18.7B in Q4 FY26 (+6% Y/Y): Americas $9.4B, EMEA $6.6B, Asia Pacific $2.7B. Operating margin 15.3%, net earnings $2.0B. See where every dollar goes — costs, profit and cash — as a Sankey from the 10-K filed Oct 16, 2026.
Drawing the Sankey…
Open the interactive Sankey → click any line for what the company wrote about it, compare Y/Y and Q/Q, export as PNG or PDF
What changed this quarter
Revenue was $18.7B in Q4 FY26, up 6% year over year and roughly flat from the previous quarter. Americas was the largest line at 50% of revenue.
Operating profit was $2.9B, a 15.3% margin (up 3.7 points year over year). Of the extra revenue versus Q4 FY25, 75% reached operating profit, above the 12% margin then. Total costs grew 2% against revenue growth of 6%. The fastest-growing cost line was General & admin (+14%). Net earnings were $2.0B, up 41% year over year. The effective tax rate was 27.7%.
Operating cash flow was $3.1B (down 21% year over year), 155% of net earnings. Non-cash charges added back $0.32B of depreciation and amortization and $0.46B of share-based compensation. Working capital and other items added $0.33B. After property & Equipment Additions ($0.25B), free cash flow as the company reports it was $2.8B.
Quarterly history
| Quarter | Form | Filed | Revenue | Y/Y | Op. margin | Net earnings | Op. cash flow |
|---|---|---|---|---|---|---|---|
| Q4 FY26 | 10-K | Oct 16, 2026 | $18.7B | +6% | 15.3% | $2.0B | $3.1B |
| Q3 FY26 | 10-Q | Jun 18, 2026 | $18.7B | +6% | 17.0% | $2.3B | $3.8B |
| Q2 FY26 | 10-Q | Mar 19, 2026 | $18.0B | +8% | 13.8% | $1.8B | $3.8B |
| Q1 FY26 | 10-Q | Dec 18, 2025 | $18.7B | +6% | 15.3% | $2.2B | $1.7B |
| Q4 FY25 | 10-K | Oct 10, 2025 | $17.6B | +7% | 11.6% | $1.4B | $3.9B |
| Q3 FY25 | 10-Q | Jun 20, 2025 | $17.7B | +8% | 16.8% | $2.2B | $3.7B |
| Q2 FY25 | 10-Q | Mar 20, 2025 | $16.7B | +5% | 13.5% | $1.8B | $2.9B |
Charts
Interactive views
The same charts as the app — open one to draw it.
💵Where each $1 goesinteractive
Loading the interactive chart…
🌏Named in Asian annual reportsinteractive
Loading the interactive chart…
🔄Rotation against the market and its industry (RRG)interactive
Loading the interactive chart…
🔍Earnings qualityinteractive
Loading the interactive chart…
⚖️Fair value by methodinteractive
Loading the interactive chart…
🔭Outlook & guidanceinteractive
Loading the interactive chart…
📈Investments: gains and what it boughtinteractive
Loading the interactive chart…
🏭Its industry’s money flow (input-output)interactive
Loading the interactive chart…
Customers and suppliers named in filings
Sells to
- U.S. government — 34% of its revenue · Stated in 10-K (sentence) · source
About Accenture
Accenture is a business reinvention and technology company. Our ambition is to be the reinvention partner of choice for our clients and lead in the safe, widespread adoption of AI, and to be the most client-focused, AI-enabled, great place to work in the world. Our people bring deep insights across industries and functions, with capabilities spanning strategy, process, operating model, change management, talent, data, technology and AI. We deliver this expertise through consulting, managed services, proprietary assets and platforms, and increasingly, software . We bring innovation and new solutions informed by our experience across industries, enabling us to apply relevant insights, capabilities and leading practices from adjacent sectors to address emerging business challenges and opportunities.
In its own words, from its 10-K, filed Oct 16, 2026.
Accenture against its Services-Business Services, NEC peers
The largest companies of the same SEC industry, each at its latest quarter. Revenue growth: +6% against the peers' median +10%. Operating margin: 15.3% against the peers' median 9.8%.
| Company | Quarter | Revenue | Y/Y | Op. margin |
|---|---|---|---|---|
| ACN Accenture | Q4 FY26 | $18.7B | +6% | 15.3% |
| UBER Uber Technologies | Q3 2026 | $14.8B | +10% | 9.8% |
| V Visa | Q4 FY26 | $12.1B | +13% | 59.8% |
| MELI MercadoLibre | Q3 2026 | $10.8B | +45% | 6.3% |
| MA Mastercard | Q3 2026 | $9.8B | +14% | 59.8% |
| PYPL PayPal Holdings | Q3 2026 | $8.6B | +2% | 16.3% |
| FISV Fiserv | Q3 2026 | $5.2B | -1% | -105.7% |
| DASH DoorDash | Q3 2026 | $4.6B | +34% | 9.6% |
| AMTM Amentum Holdings | Q3 FY26 | $3.5B | -2% | 4.9% |
Source: Accenture 10-K on SEC EDGAR · CIK 1467373 · Services-Business Services, NEC
Guidance and outlook
More on ACN
History
Every quarter: Q4 FY26 results · Q3 FY26 results · Q2 FY26 results · Q1 FY26 results · Q4 FY25 results · Q3 FY25 results · Q2 FY25 results