Filing Flows › Industrials › Fiserv (FISV)
Fiserv (FISV) earnings and revenue breakdown
Latest: Q3 2026 · 10-Q filed Nov 4, 2026 · Fiserv (FISV) Q3 2026 earnings results →
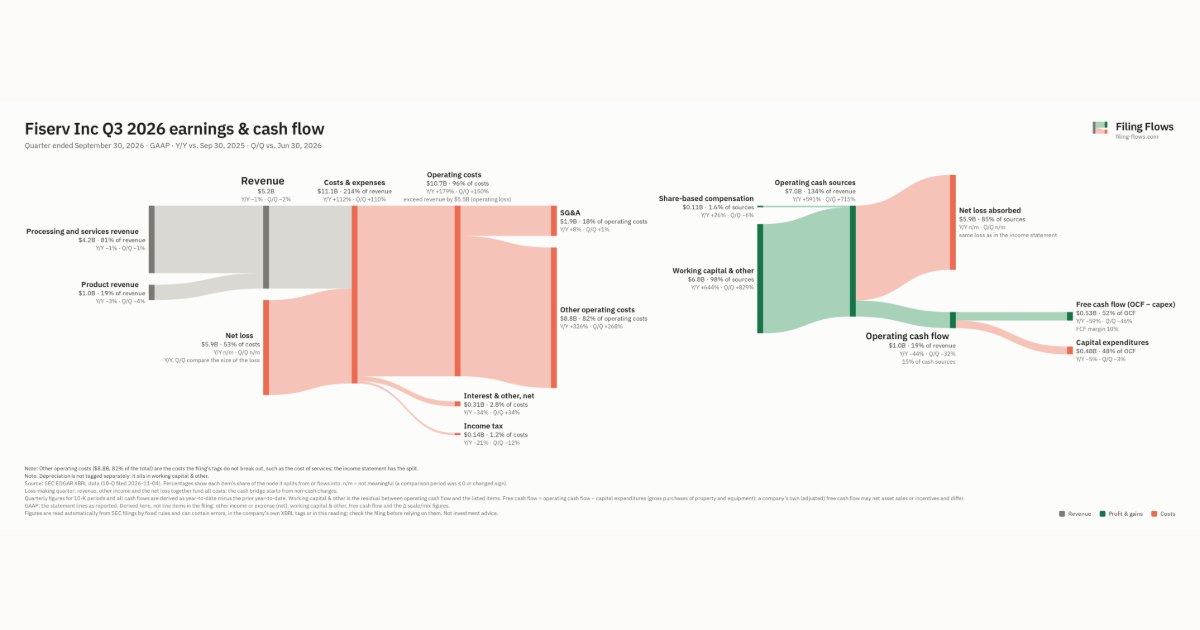
Q3 2026 Revenue down 1% year over year to $5.2B · 114¢ of every $1 of revenue lost · operating margin -105.7%
Fiserv made $5.2B in Q3 2026 (-1% Y/Y): Processing and services revenue $4.2B, Product revenue $965M. Operating margin -105.7%, net loss $5.9B. See where every dollar goes — costs, profit and cash — as a Sankey from the 10-Q filed Nov 4, 2026.
Drawing the Sankey…
Open the interactive Sankey → click any line for what the company wrote about it, compare Y/Y and Q/Q, export as PNG or PDF
What changed this quarter
Revenue was $5.2B in Q3 2026, down 1% year over year and down 2% from the previous quarter. Processing and services revenue was the largest line at 81% of revenue. Processing and services revenue lost $0.04B year over year (down 1%), 63% of the total change.
Operating costs exceeded revenue by $5.5B, an operating margin of -105.7%. Total costs grew 179% against a revenue fall of 1%. The fastest-growing cost line was Other operating costs (+326%). The quarter ended with a net loss of $5.9B, after a profit of $0.63B the previous quarter.
Operating cash flow was $1.0B (down 44% year over year). Non-cash charges added back $0.11B of share-based compensation. Working capital and other items added $6.8B. Capital expenditures of $0.48B left free cash flow of $0.53B.
Quarterly history
| Quarter | Form | Filed | Revenue | Y/Y | Op. margin | Net earnings | Op. cash flow |
|---|---|---|---|---|---|---|---|
| Q3 2026 | 10-Q | Nov 4, 2026 | $5.2B | -1% | -105.7% | −$5.9B | $1.0B |
| Q2 2026 | 10-Q | Aug 7, 2026 | $5.3B | -4% | 19.2% | $630M | $1.5B |
| Q1 2026 | 10-Q | May 6, 2026 | $5.0B | -2% | 18.3% | $573M | $599M |
| Q4 2025 | 10-K | Feb 19, 2026 | $5.3B | +0.6% | 24.4% | $811M | $1.9B |
| Q3 2025 | 10-Q | Oct 30, 2025 | $5.3B | +0.9% | 27.3% | $792M | $1.8B |
| Q2 2025 | 10-Q | Jul 24, 2025 | $5.5B | +8% | 30.7% | $1.0B | $1.7B |
| Q1 2025 | 10-Q | Apr 25, 2025 | $5.1B | +5% | 27.2% | $851M | $648M |
Charts
Interactive views
The same charts as the app — open one to draw it.
💵Where each $1 goesinteractive
Loading the interactive chart…
🌏Named in Asian annual reportsinteractive
Loading the interactive chart…
🔄Rotation against the market and its industry (RRG)interactive
Loading the interactive chart…
🔍Earnings qualityinteractive
Loading the interactive chart…
⚖️Fair value by methodinteractive
Loading the interactive chart…
🔭Outlook & guidanceinteractive
Loading the interactive chart…
📈Investments: gains and what it boughtinteractive
Loading the interactive chart…
🏭Its industry’s money flow (input-output)interactive
Loading the interactive chart…
About Fiserv
Fiserv, Inc. is a leading global provider of payments and financial services technology solutions. We are publicly traded on the NASDAQ Global Select Market and part of the S&P 500 Index. We serve clients around the globe, including merchants, banks, credit unions, other financial institutions, corporate and public sector clients. We help clients achieve best-in-class results through a commitment to innovation and excellence in areas including account processing and digital banking solutions; card issuer processing and network services; payments; e-commerce; merchant acquiring and processing; and the Clover ® cloud-based point-of-sale (“POS”) and business management platform. Most of the products and services we provide are necessary for our clients to operate their businesses and are therefore non-discretionary in nature.
In its own words, from its 10-K, filed Feb 19, 2026.
Fiserv against its Services-Business Services, NEC peers
The largest companies of the same SEC industry, each at its latest quarter. Revenue growth: -1% against the peers' median +10%. Operating margin: -105.7% against the peers' median 9.8%.
| Company | Quarter | Revenue | Y/Y | Op. margin |
|---|---|---|---|---|
| FISV Fiserv | Q3 2026 | $5.2B | -1% | -105.7% |
| ACN Accenture | Q4 FY26 | $18.7B | +6% | 15.3% |
| UBER Uber Technologies | Q3 2026 | $14.8B | +10% | 9.8% |
| V Visa | Q4 FY26 | $12.1B | +13% | 59.8% |
| MELI MercadoLibre | Q3 2026 | $10.8B | +45% | 6.3% |
| MA Mastercard | Q3 2026 | $9.8B | +14% | 59.8% |
| PYPL PayPal Holdings | Q3 2026 | $8.6B | +2% | 16.3% |
| DASH DoorDash | Q3 2026 | $4.6B | +34% | 9.6% |
| AMTM Amentum Holdings | Q3 FY26 | $3.5B | -2% | 4.9% |
Source: Fiserv 10-Q on SEC EDGAR · CIK 798354 · Services-Business Services, NEC
Guidance and outlook
13F: who owns FISV and who is buying
More on FISV
History
Every quarter: Q3 2026 results · Q2 2026 results · Q1 2026 results · Q4 2025 results · Q3 2025 results · Q2 2025 results · Q1 2025 results