Filing Flows › Industrials › Mastercard (MA)
Mastercard (MA) earnings and revenue breakdown
Latest: Q3 2026 · 10-Q filed Oct 29, 2026 · Mastercard (MA) Q3 2026 earnings results →
Q3 2026 Revenue up 14% year over year to $9.8B · 47¢ of every $1 of revenue kept as net profit · operating margin 59.8%
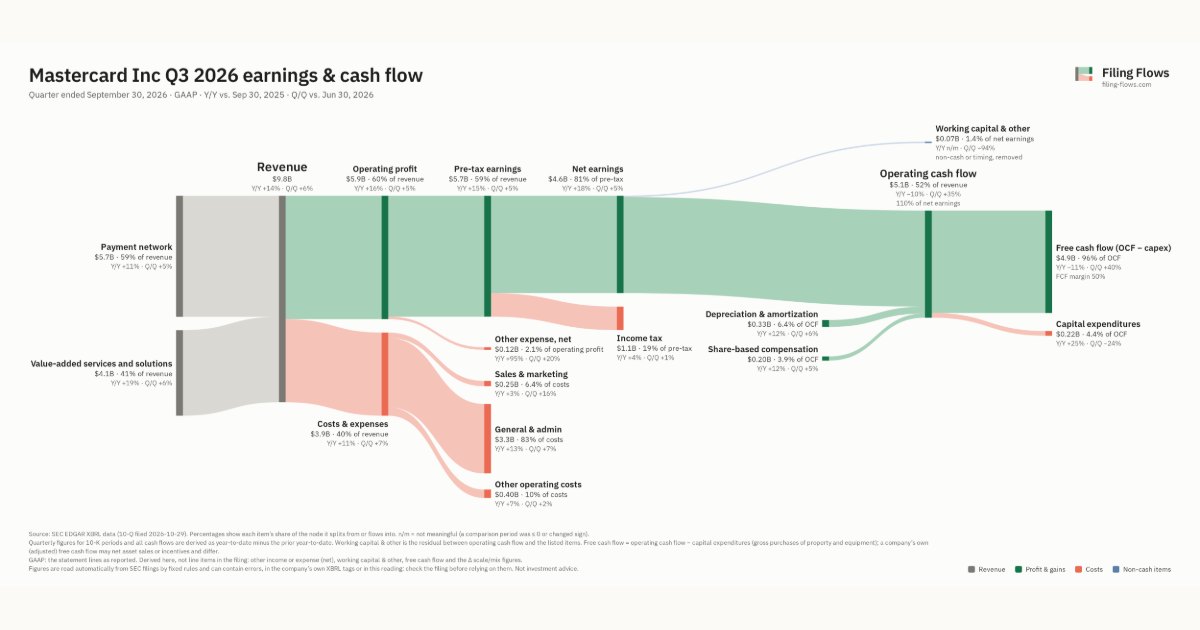
Mastercard made $9.8B in Q3 2026 (+14% Y/Y): Payment network $5.7B, Value-added services and solutions $4.1B. Operating margin 59.8%, net earnings $4.6B. See where every dollar goes — costs, profit and cash — as a Sankey from the 10-Q filed Oct 29, 2026.
Drawing the Sankey…
Open the interactive Sankey → click any line for what the company wrote about it, compare Y/Y and Q/Q, export as PNG or PDF
What changed this quarter
Revenue was $9.8B in Q3 2026, up 14% year over year and up 6% from the previous quarter. Payment network was the largest line at 59% of revenue. Value-added services and solutions added $0.64B year over year (up 19%), 53% of the total change.
Operating profit was $5.9B, a 59.8% margin (up 0.9 points year over year). Of the extra revenue versus Q3 2025, 66% reached operating profit, above the 59% margin then. Total costs grew 11% against revenue growth of 14%. The fastest-growing cost line was General & admin (+13%). Net earnings were $4.6B, up 18% year over year. The effective tax rate was 19.4%.
Operating cash flow was $5.1B (down 10% year over year), 110% of net earnings. Non-cash charges added back $0.33B of depreciation and amortization and $0.20B of share-based compensation. Capital expenditures of $0.22B left free cash flow of $4.9B.
Quarterly history
| Quarter | Form | Filed | Revenue | Y/Y | Op. margin | Net earnings | Op. cash flow |
|---|---|---|---|---|---|---|---|
| Q3 2026 | 10-Q | Oct 29, 2026 | $9.8B | +14% | 59.8% | $4.6B | $5.1B |
| Q2 2026 | 10-Q | Jul 30, 2026 | $9.3B | +14% | 60.2% | $4.4B | $3.8B |
| Q1 2026 | 10-Q | Apr 30, 2026 | $8.4B | +16% | 58.4% | $3.9B | $3.0B |
| Q4 2025 | 10-K | Feb 11, 2026 | $8.8B | +18% | 55.8% | $4.1B | $5.0B |
| Q3 2025 | 10-Q | Oct 30, 2025 | $8.6B | +17% | 58.8% | $3.9B | $5.7B |
| Q2 2025 | 10-Q | Jul 31, 2025 | $8.1B | +17% | 58.7% | $3.7B | $4.6B |
| Q1 2025 | 10-Q | May 1, 2025 | $7.2B | +14% | 57.2% | $3.3B | $2.4B |
Charts
Interactive views
The same charts as the app — open one to draw it.
💵Where each $1 goesinteractive
Loading the interactive chart…
🌏Named in Asian annual reportsinteractive
Loading the interactive chart…
🔄Rotation against the market and its industry (RRG)interactive
Loading the interactive chart…
🔍Earnings qualityinteractive
Loading the interactive chart…
⚖️Fair value by methodinteractive
Loading the interactive chart…
🔭Outlook & guidanceinteractive
Loading the interactive chart…
📈Investments: gains and what it boughtinteractive
Loading the interactive chart…
🏭Its industry’s money flow (input-output)interactive
Loading the interactive chart…
About Mastercard
places). In addition, the interpretation and application of these privacy, data, AI and information security laws and regulations are often uncertain and in a state of flux, thus requiring constant monitoring and governance. Additional Regulatory Developments. Various regulatory agencies around the world continue to examine a wide variety of issues that could impact us, including evolving laws and guidance surrounding buy-now-pay-later, open finance, credit reporting, digital currencies (including stablecoins), marijuana, prepaid payroll cards, identity theft, account management guidelines, disclosure rules, marketing and operational resilience. Additionally, various jurisdictions have adopted or are increasingly considering adopting laws, regulations and oversight expectations requiring disclosure on environmental, social and governance matters.
In its own words, from its 10-K, filed Feb 11, 2026.
Mastercard against its Services-Business Services, NEC peers
The largest companies of the same SEC industry, each at its latest quarter. Revenue growth: +14% against the peers' median +10%. Operating margin: 59.8% against the peers' median 9.8%.
| Company | Quarter | Revenue | Y/Y | Op. margin |
|---|---|---|---|---|
| MA Mastercard | Q3 2026 | $9.8B | +14% | 59.8% |
| ACN Accenture | Q4 FY26 | $18.7B | +6% | 15.3% |
| UBER Uber Technologies | Q3 2026 | $14.8B | +10% | 9.8% |
| V Visa | Q4 FY26 | $12.1B | +13% | 59.8% |
| MELI MercadoLibre | Q3 2026 | $10.8B | +45% | 6.3% |
| PYPL PayPal Holdings | Q3 2026 | $8.6B | +2% | 16.3% |
| FISV Fiserv | Q3 2026 | $5.2B | -1% | -105.7% |
| DASH DoorDash | Q3 2026 | $4.6B | +34% | 9.6% |
| AMTM Amentum Holdings | Q3 FY26 | $3.5B | -2% | 4.9% |
Source: Mastercard 10-Q on SEC EDGAR · CIK 1141391 · Services-Business Services, NEC
Guidance and outlook
13F: who owns MA and who is buying
More on MA
History
Every quarter: Q3 2026 results · Q2 2026 results · Q1 2026 results · Q4 2025 results · Q3 2025 results · Q2 2025 results · Q1 2025 results