Filing Flows › Financials › American Financial Group (AFG)
American Financial Group (AFG) earnings and revenue breakdown
Latest: Q3 2026 · 10-Q filed Nov 5, 2026 · American Financial Group (AFG) Q3 2026 earnings results →
Q3 2026 Revenue up 11% year over year to $2.6B · 11¢ of every $1 of revenue kept as net profit · operating margin 13.9%
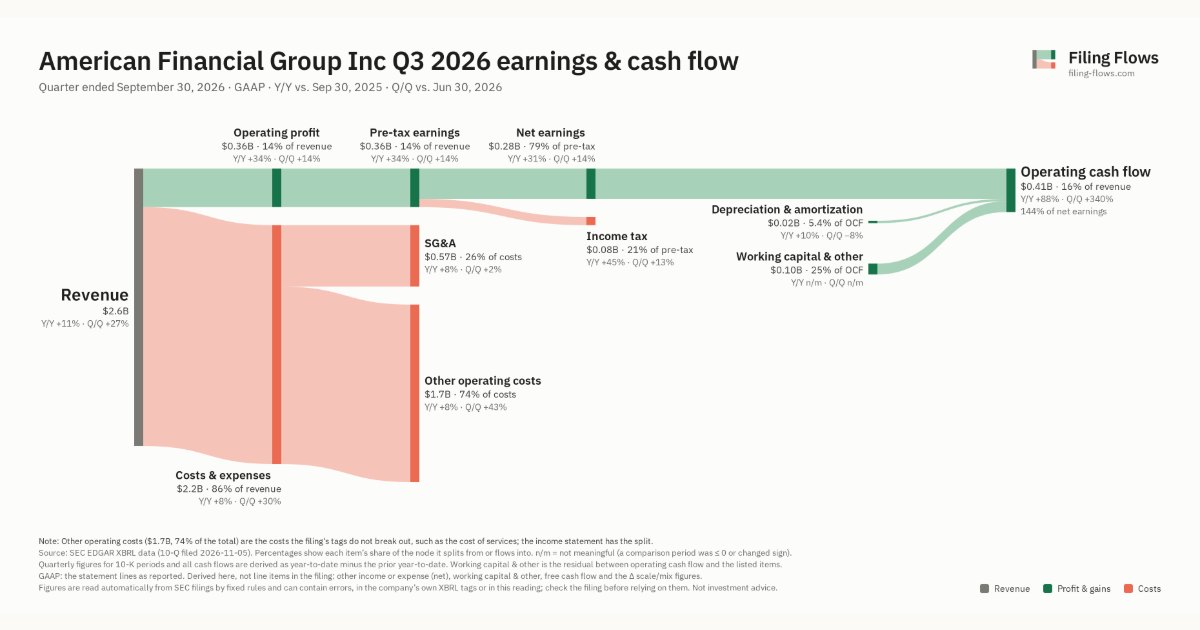
American Financial Group made $2.6B in Q3 2026 (+11% Y/Y). Operating margin 13.9%, net earnings $282M. See where every dollar goes — costs, profit and cash — as a Sankey from the 10-Q filed Nov 5, 2026.
Drawing the Sankey…
Open the interactive Sankey → click any line for what the company wrote about it, compare Y/Y and Q/Q, export as PNG or PDF
What changed this quarter
Revenue was $2.6B in Q3 2026, up 11% year over year and up 27% from the previous quarter.
Operating profit was $0.36B, a 13.9% margin (up 2.4 points year over year). Of the extra revenue versus Q3 2025, 36% reached operating profit, above the 11% margin then. Total costs grew 8% against revenue growth of 11%. Net earnings were $0.28B, up 31% year over year. The effective tax rate was 21.4%.
Operating cash flow was $0.41B (up 88% year over year), 144% of net earnings. Non-cash charges added back $0.02B of depreciation and amortization. Working capital and other items added $0.10B.
Quarterly history
| Quarter | Form | Filed | Revenue | Y/Y | Op. margin | Net earnings | Op. cash flow |
|---|---|---|---|---|---|---|---|
| Q3 2026 | 10-Q | Nov 5, 2026 | $2.6B | +11% | 13.9% | $282M | $405M |
| Q2 2026 | 10-Q | Aug 6, 2026 | $2.0B | +6% | 15.6% | $248M | $92.0M |
| Q1 2026 | 10-Q | May 7, 2026 | $1.9B | -0.1% | 12.9% | $191M | $474M |
| Q4 2025 | 10-K | Feb 25, 2026 | $2.1B | -4% | 18.4% | $299M | $784M |
| Q3 2025 | 10-Q | Nov 6, 2025 | $2.3B | -2% | 11.5% | $215M | $216M |
| Q2 2025 | 10-Q | Aug 7, 2025 | $1.9B | +1% | 11.9% | $174M | $191M |
| Q1 2025 | 10-Q | May 8, 2025 | $1.9B | -3% | 10.6% | $154M | $342M |
Charts
Interactive views
The same charts as the app — open one to draw it.
💵Where each $1 goesinteractive
Loading the interactive chart…
🌏Named in Asian annual reportsinteractive
Loading the interactive chart…
🔄Rotation against the market and its industry (RRG)interactive
Loading the interactive chart…
🔍Earnings qualityinteractive
Loading the interactive chart…
⚖️Fair value by methodinteractive
Loading the interactive chart…
🔭Outlook & guidanceinteractive
Loading the interactive chart…
📈Investments: gains and what it boughtinteractive
Loading the interactive chart…
🏭Its industry’s money flow (input-output)interactive
Loading the interactive chart…
About American Financial Group
American Financial Group, Inc. (“AFG” or the “Company”) is an insurance holding company. Through the operations of Great American Insurance Group, AFG is engaged in property and casualty insurance, focusing on specialized commercial products for businesses. AFG’s in-house team of investment professionals oversees the Company’s investment portfolio. The members of the Great American Insurance Group have been in business for over 150 years. Management believes that over 55% of the 2025 gross written premiums in AFG’s Specialty property and casualty group are produced by businesses that rank in the “top 10” amongst competitors based on gross written premiums.
In its own words, from its 10-K, filed Feb 25, 2026.
American Financial Group against its Fire, Marine & Casualty Insurance peers
The largest companies of the same SEC industry, each at its latest quarter. Revenue growth: +11% against the peers' median +3%. Operating margin: 13.9% against the peers' median 15.1%.
| Company | Quarter | Revenue | Y/Y | Op. margin |
|---|---|---|---|---|
| AFG American Financial Group | Q3 2026 | $2.6B | +11% | 13.9% |
| BRK-B Berkshire Hathaway | Q2 2026 | $101.8B | +10% | 15.5% |
| PGR Progressive | Q3 2026 | $23.2B | +3% | 14.0% |
| ALL Allstate | Q3 2026 | $17.3B | +0.5% | 15.1% |
| CB Chubb | Q3 2026 | $16.2B | +0.3% | 21.0% |
| TRV Travelers Companies | Q3 2026 | $12.4B | -0.5% | 19.1% |
| AIG American International Group | Q3 2026 | $7.4B | +17% | 15.0% |
| HIG Hartford Insurance Group | Q3 2026 | $7.2B | +4% | 21.9% |
| L Loews | Q3 2026 | $4.8B | +2% | 8.5% |
Source: American Financial Group 10-Q on SEC EDGAR · CIK 1042046 · Fire, Marine & Casualty Insurance
Guidance and outlook
13F: who owns AFG and who is buying
More on AFG
- How American Financial Group makes money: revenue by segment
- American Financial Group next earnings date and what analysts expect
- American Financial Group stock forecast, price target and fair value
- Who owns American Financial Group stock: holders, funds and Congress trades
- American Financial Group guidance and outlook
- American Financial Group recalls, complaints and regulation
History
Every quarter: Q3 2026 results · Q2 2026 results · Q1 2026 results · Q4 2025 results · Q3 2025 results · Q2 2025 results · Q1 2025 results