Filing Flows › Technology › Acuity (AYI)
Acuity (AYI) earnings and revenue breakdown
Latest: Q4 FY26 · 10-K filed Oct 23, 2026 · Acuity (AYI) Q4 FY26 earnings results →
Q4 FY26 Revenue up 3% year over year to $1.2B · 14¢ of every $1 of revenue kept as net profit · operating margin 18.2%
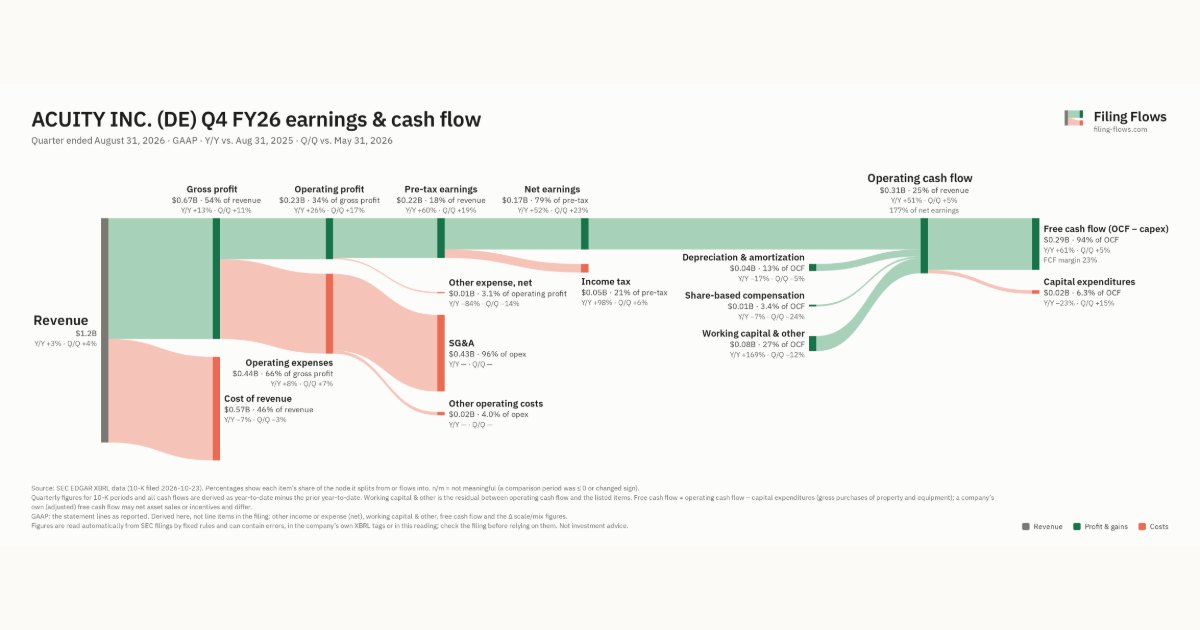
Acuity made $1.2B in Q4 FY26 (+3% Y/Y). Operating margin 18.2%, net earnings $173M. See where every dollar goes — costs, profit and cash — as a Sankey from the 10-K filed Oct 23, 2026.
Drawing the Sankey…
Open the interactive Sankey → click any line for what the company wrote about it, compare Y/Y and Q/Q, export as PNG or PDF
What changed this quarter
Revenue was $1.2B in Q4 FY26, up 3% year over year and up 4% from the previous quarter.
Gross margin was 53.8%, up 5.0 points from Q4 FY25. Operating profit was $0.23B, a 18.2% margin (up 3.3 points year over year). Of the extra revenue versus Q4 FY25, 131% reached operating profit, above the 15% margin then. Operating expenses grew 8% against revenue growth of 3%. Net earnings were $0.17B, up 52% year over year. The effective tax rate was 21.4%.
Operating cash flow was $0.31B (up 51% year over year), 177% of net earnings. Non-cash charges added back $0.04B of depreciation and amortization and $0.01B of share-based compensation. Working capital and other items added $0.08B. Capital expenditures of $0.02B left free cash flow of $0.29B.
Quarterly history
| Quarter | Form | Filed | Revenue | Y/Y | Op. margin | Net earnings | Op. cash flow |
|---|---|---|---|---|---|---|---|
| Q4 FY26 | 10-K | Oct 23, 2026 | $1.2B | +3% | 18.2% | $173M | $305M |
| Q3 FY26 | 10-Q | Jun 25, 2026 | $1.2B | +2% | 16.1% | $141M | $290M |
| Q2 FY26 | 10-Q | Apr 2, 2026 | $1.1B | +5% | 12.6% | $96.8M | $89.1M |
| Q1 FY26 | 10-Q | Jan 8, 2026 | $1.1B | +20% | 14.0% | $120M | $141M |
| Q4 FY25 | 10-K | Oct 27, 2025 | $1.2B | +17% | 14.9% | $114M | $202M |
| Q3 FY25 | 10-Q | Jun 26, 2025 | $1.2B | +22% | 11.9% | $98.4M | $207M |
| Q2 FY25 | 10-Q | Apr 3, 2025 | $1.0B | +11% | 11.0% | $77.5M | $59.4M |
Charts
Interactive views
The same charts as the app — open one to draw it.
💵Where each $1 goesinteractive
Loading the interactive chart…
🌏Named in Asian annual reportsinteractive
Loading the interactive chart…
🔄Rotation against the market and its industry (RRG)interactive
Loading the interactive chart…
🔍Earnings qualityinteractive
Loading the interactive chart…
⚖️Fair value by methodinteractive
Loading the interactive chart…
🔭Outlook & guidanceinteractive
Loading the interactive chart…
📈Investments: gains and what it boughtinteractive
Loading the interactive chart…
🏭Its industry’s money flow (input-output)interactive
Loading the interactive chart…
About Acuity
Acuity Inc. (referred to herein as “we,” “our,” “us,” the “Company,” or similar references) is a market-leading industrial technology company. We use technology to solve problems in spaces, light, and more things to come. Through our two business segments, Acuity Brands Lighting (“ABL”) and Acuity Intelligent Spaces (“AIS”), we design, manufacture, and bring to market products and services that make a valuable difference in people’s lives. We achieve growth through the development of innovative new products and services, including lighting, lighting controls, building management solutions, and an audio, video, and control platform. We focus on customer outcomes and drive growth and productivity to increase market share and deliver superior returns. We look to aggressively deploy capital to grow the business and to enter attractive new verticals.
In its own words, from its 10-K, filed Oct 23, 2026.
Acuity against its Electric Lighting & Wiring Equipment peers
The largest companies of the same SEC industry, each at its latest quarter. Revenue growth: +3% against the peers' median +10%. Operating margin: 18.2% against the peers' median -3.4%.
| Company | Quarter | Revenue | Y/Y | Op. margin |
|---|---|---|---|---|
| AYI Acuity | Q4 FY26 | $1.2B | +3% | 18.2% |
| LYTS LSI Industries | Q1 FY27 | $226M | +44% | 6.3% |
| SKYX Skyx Platforms | Q2 2026 | $25.3M | +10% | -28.0% |
| OESX Orion Energy Systems | Q2 FY27 | $21.7M | +9% | -3.4% |
| EFOI Energy Focus | Q2 2026 | $3.7M | +228% | -23.2% |
Source: Acuity 10-K on SEC EDGAR · CIK 1144215 · Electric Lighting & Wiring Equipment
13F: who owns AYI and who is buying
More on AYI
History
Every quarter: Q4 FY26 results · Q3 FY26 results · Q2 FY26 results · Q1 FY26 results · Q4 FY25 results · Q3 FY25 results · Q2 FY25 results