Filing Flows › Industrials › Boeing (BA)
Boeing (BA) earnings and revenue breakdown
Latest: Q3 2026 · 10-Q filed Oct 27, 2026 · Boeing (BA) Q3 2026 earnings results →
Q3 2026 Revenue up 4% year over year to $24.2B · 0¢ of every $1 of revenue lost · operating margin 1.5%
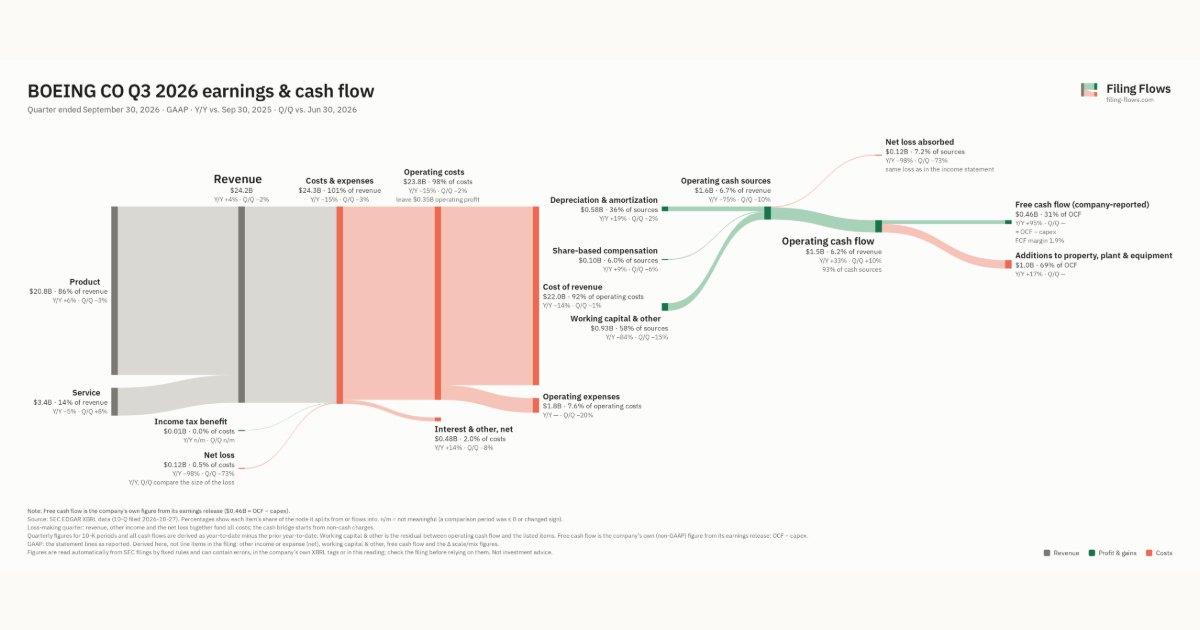
Boeing made $24.2B in Q3 2026 (+4% Y/Y): Product $20.8B, Service $3.4B. Operating margin 1.5%, net loss $116M. See where every dollar goes — costs, profit and cash — as a Sankey from the 10-Q filed Oct 27, 2026.
Drawing the Sankey…
Open the interactive Sankey → click any line for what the company wrote about it, compare Y/Y and Q/Q, export as PNG or PDF
What changed this quarter
Revenue was $24.2B in Q3 2026, up 4% year over year and down 2% from the previous quarter. Product was the largest line at 86% of revenue. Product added $1.1B year over year (up 6%), 121% of the total change. Service declined 5%.
Gross margin was 9.0%. Operating profit was $0.35B, a 1.5% margin (up 22.0 points year over year). The quarter ended with a net loss of $0.12B, narrower than the previous quarter's $0.43B loss. Net interest and other expense of $0.48B was the main reason.
Operating cash flow was $1.5B (up 33% year over year). Non-cash charges added back $0.58B of depreciation and amortization and $0.10B of share-based compensation. Working capital and other items added $0.93B. After additions to property, plant & equipment ($1.0B), free cash flow as the company reports it was $0.46B.
Quarterly history
| Quarter | Form | Filed | Revenue | Y/Y | Op. margin | Net earnings | Op. cash flow |
|---|---|---|---|---|---|---|---|
| Q3 2026 | 10-Q | Oct 27, 2026 | $24.2B | +4% | 1.5% | −$116M | $1.5B |
| Q2 2026 | 10-Q | Jul 28, 2026 | $24.6B | +8% | 0.6% | −$428M | $1.4B |
| Q1 2026 | 10-Q | Apr 22, 2026 | $22.2B | +14% | 2.0% | −$7.0M | −$179M |
| Q4 2025 | 10-K | Jan 30, 2026 | $23.9B | +57% | 36.7% | $8.2B | $1.3B |
| Q3 2025 | 10-Q | Oct 29, 2025 | $23.3B | +30% | -20.5% | −$5.3B | $1.1B |
| Q2 2025 | 10-Q | Jul 29, 2025 | $22.7B | +35% | -0.8% | −$612M | $227M |
| Q1 2025 | 10-Q | Apr 23, 2025 | $19.5B | +18% | 2.4% | −$31.0M | −$1.6B |
Charts
Interactive views
The same charts as the app — open one to draw it.
💵Where each $1 goesinteractive
Loading the interactive chart…
🌏Named in Asian annual reportsinteractive
Loading the interactive chart…
🔄Rotation against the market and its industry (RRG)interactive
Loading the interactive chart…
🔍Earnings qualityinteractive
Loading the interactive chart…
⚖️Fair value by methodinteractive
Loading the interactive chart…
🔭Outlook & guidanceinteractive
Loading the interactive chart…
📈Investments: gains and what it boughtinteractive
Loading the interactive chart…
🏭Its industry’s money flow (input-output)interactive
Loading the interactive chart…
Customers and suppliers named in filings
Sells to
- U.S. government — 35% of its revenue · Stated in 10-K (sentence) · source
- ATRO · Stated in 10-K (named, share not stated) · source
- DCO · Stated in 10-K (share of revenue from its products) · source
- LUV · Stated in 10-K (named, share not stated) · source
- ALGT · Stated in 10-K (named, share not stated) · source
- AAL · Stated in 10-K (named, share not stated) · source
Buys from
- DCO — 13% of the supplier’s revenue · Stated in 10-K (XBRL) · source
- ATRO — 10% of the supplier’s revenue · Stated in 10-K (sentence) · source
- HXL — 10% of the supplier’s revenue · Stated in 10-K (sentence) · source
- MOG-A — 10% of the supplier’s revenue · Stated in 10-K (XBRL) · source
- IA — 8% of the supplier’s revenue · Stated in 10-K (sentence) · source
- RBC · Stated in 10-K (receivables) · source
About Boeing
The Boeing Company, together with its subsidiaries (herein referred to as “Boeing,” the “Company,” “we,” “us,” “our”), is one of the world’s major aerospace firms. This segment develops, produces and markets commercial jet aircraft principally to the commercial airline industry worldwide. We are a leading producer of commercial aircraft and offer a family of commercial jetliners designed to meet a broad spectrum of global passenger and cargo requirements of airlines. This family of commercial jet aircraft in production includes the 737 narrow-body model and the 767, 777 and 787 wide-body models. Development continues on the 777X program and the 737-7 and 737-10 derivatives.
In its own words, from its 10-K, filed Jan 30, 2026.
Boeing against its Aircraft peers
The largest companies of the same SEC industry, each at its latest quarter. Revenue growth: +4% against the peers' median +76%. Operating margin: 1.5% against the peers' median -208.7%.
| Company | Quarter | Revenue | Y/Y | Op. margin |
|---|---|---|---|---|
| BA Boeing | Q3 2026 | $24.2B | +4% | 1.5% |
| AVAV AeroVironment | Q1 FY27 | $480M | +6% | -2.3% |
| AVEX Aevex | Q2 2026 | $202M | +100% | 7.6% |
| JOBY Joby Aviation | Q3 2026 | $55.1M | +144% | -504.8% |
| AIRO Airo Group Holdings | Q2 2026 | $43.2M | +76% | 3.8% |
| BETA Beta Technologies | Q3 2026 | $17.7M | +98% | -723.2% |
| ACHR Archer Aviation | Q2 2026 | $5.0M | — | n/m |
| UAVS AgEagle Aerial Systems | Q2 2026 | $2.7M | -36% | -208.7% |
| DUKR Duke Robotics | Q2 2026 | $149K | +4% | -622.8% |
Source: Boeing 10-Q on SEC EDGAR · CIK 12927 · Aircraft
Guidance and outlook
13F: who owns BA and who is buying
More on BA
History
Every quarter: Q3 2026 results · Q2 2026 results · Q1 2026 results · Q4 2025 results · Q3 2025 results · Q2 2025 results · Q1 2025 results