Filing Flows › Health Care › Becton Dickinson (BDX)
Becton Dickinson (BDX) earnings and revenue breakdown
Latest: Q3 FY26 · 10-Q filed Aug 6, 2026 · Becton Dickinson (BDX) Q3 FY26 earnings results →
Q3 FY26 Revenue up 5% year over year to $5.0B · 8¢ of every $1 of revenue kept as net profit · operating margin 13.3%
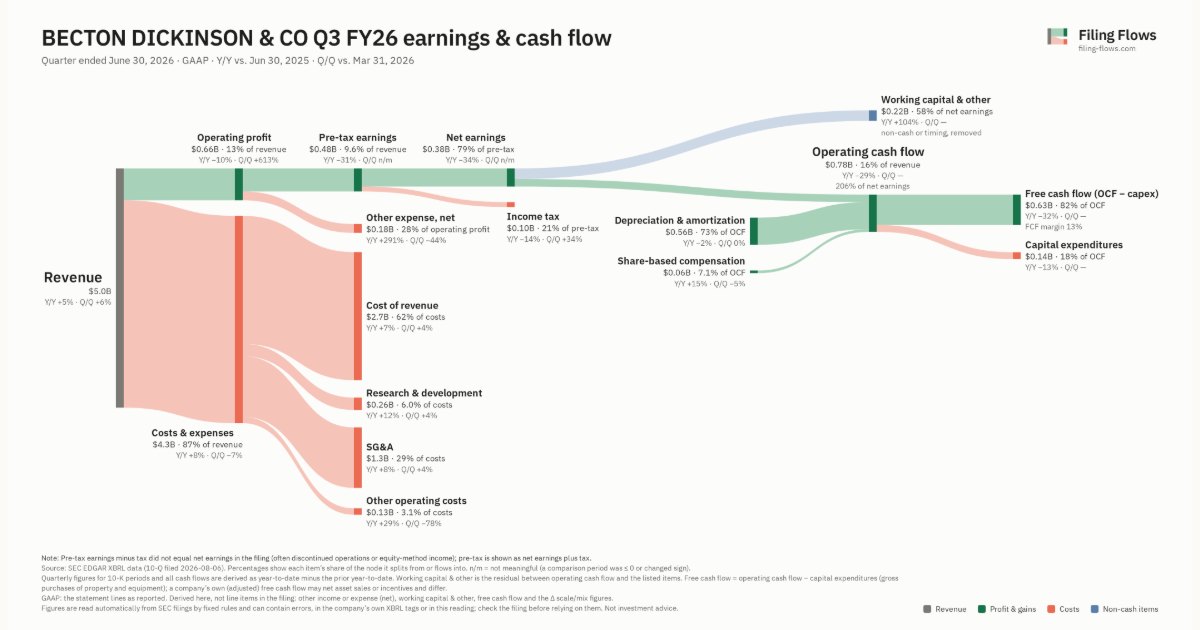
Becton Dickinson made $5.0B in Q3 FY26 (+5% Y/Y). Operating margin 13.3%, net earnings $377M. See where every dollar goes — costs, profit and cash — as a Sankey from the 10-Q filed Aug 6, 2026.
Drawing the Sankey…
Open the interactive Sankey → click any line for what the company wrote about it, compare Y/Y and Q/Q, export as PNG or PDF
What changed this quarter
Revenue was $5.0B in Q3 FY26, up 5% year over year and up 6% from the previous quarter.
Operating profit was $0.66B, a 13.3% margin (down 2.3 points year over year). Operating profit fell $0.08B even though revenue rose $0.26B versus Q3 FY25, so costs grew faster than sales. Total costs grew 8% against revenue growth of 5%. The fastest-growing cost line was Other operating costs (+29%). Net earnings were $0.38B, down 34% year over year. The effective tax rate was 21.3%.
Operating cash flow was $0.78B (down 29% year over year), 206% of net earnings. Non-cash charges added back $0.56B of depreciation and amortization and $0.06B of share-based compensation. Working capital and other items used $0.22B. Capital expenditures of $0.14B left free cash flow of $0.63B.
Quarterly history
| Quarter | Form | Filed | Revenue | Y/Y | Op. margin | Net earnings | Op. cash flow |
|---|---|---|---|---|---|---|---|
| Q3 FY26 | 10-Q | Aug 6, 2026 | $5.0B | +5% | 13.3% | $377M | $776M |
| Q2 FY26 | 10-Q | May 7, 2026 | $4.7B | +5% | 2.0% | −$311M | — |
| Q1 FY26 | 10-Q | Feb 9, 2026 | $5.3B | +2% | 10.5% | $382M | $657M |
| Q4 FY25 | 10-K | Nov 25, 2025 | $5.9B | +8% | 11.8% | $493M | $1.4B |
| Q3 FY25 | 10-Q | Aug 7, 2025 | $5.5B | +10% | 16.0% | $574M | $1.2B |
| Q2 FY25 | 10-Q | May 1, 2025 | $5.3B | +4% | 10.4% | $308M | $164M |
| Q4 FY24 | 10-K | Nov 27, 2024 | $5.4B | +7% | 11.4% | $400M | $1.2B |
Charts
In supply chains and themes
Interactive views
The same charts as the app — open one to draw it.
💵Where each $1 goesinteractive
Loading the interactive chart…
🌏Named in Asian annual reportsinteractive
Loading the interactive chart…
🔄Rotation against the market and its industry (RRG)interactive
Loading the interactive chart…
🔍Earnings qualityinteractive
Loading the interactive chart…
⚖️Fair value by methodinteractive
Loading the interactive chart…
🔭Outlook & guidanceinteractive
Loading the interactive chart…
📈Investments: gains and what it boughtinteractive
Loading the interactive chart…
🏭Its industry’s money flow (input-output)interactive
Loading the interactive chart…
About Becton Dickinson
Becton, Dickinson and Company (also referred to herein as "BD") was incorporated under the laws of the State of New Jersey in November 1906, as successor to a New York business started in 1897. BD’s executive offices are located at 1 Becton Drive, Franklin Lakes, New Jersey 07417-1880, and its telephone number is (201) 847-6800. All references in this Form 10-K to "BD", "the Company", "we", "our" or "us" refer to Becton, Dickinson and Company and its domestic and foreign subsidiaries, unless otherwise indicated by the context. BD is a global medical technology company engaged in the development, manufacture and sale of a broad range of medical supplies, devices, laboratory equipment and diagnostic products used by healthcare institutions, physicians, life science researchers, clinical laboratories, the pharmaceutical industry and the general public.
In its own words, from its 10-K, filed Nov 25, 2025.
Becton Dickinson against its Surgical & Medical Instruments & Apparatus peers
The largest companies of the same SEC industry, each at its latest quarter. Revenue growth: +5% against the peers' median +5%. Operating margin: 13.3% against the peers' median 15.9%.
| Company | Quarter | Revenue | Y/Y | Op. margin |
|---|---|---|---|---|
| BDX Becton Dickinson | Q3 FY26 | $5.0B | +5% | 13.3% |
| MDLN Medline | Q3 2026 | $7.9B | +10% | 6.4% |
| MMM 3M | Q3 2026 | $6.6B | +1% | 23.7% |
| SYK Stryker | Q3 2026 | $6.5B | +8% | 15.9% |
| BSX Boston Scientific | Q3 2026 | $5.1B | +1% | 16.1% |
| BAX Baxter International | Q3 2026 | $3.0B | +5% | 7.6% |
| SOLV Solventum | Q3 2026 | $1.9B | -7% | 3.5% |
| RMD ResMed | Q1 FY27 | $1.4B | +6% | 32.0% |
| DXCM DexCom | Q3 2026 | $1.3B | +11% | 24.3% |
Source: Becton Dickinson 10-Q on SEC EDGAR · CIK 10795 · Surgical & Medical Instruments & Apparatus
Guidance and outlook
13F: who owns BDX and who is buying
More on BDX
- How Becton Dickinson makes money: revenue by segment
- Becton Dickinson next earnings date and what analysts expect
- Becton Dickinson stock forecast, price target and fair value
- Who owns Becton Dickinson stock: holders, funds and Congress trades
- Becton Dickinson guidance and outlook
- Is Becton Dickinson a takeover target? LBO and rumors
- Becton Dickinson recalls, complaints and regulation
History
Every quarter: Q3 FY26 results · Q2 FY26 results · Q1 FY26 results · Q4 FY25 results · Q3 FY25 results · Q2 FY25 results · Q4 FY24 results